LEO Holds Steady While Pi Network and Mantle Test Nerve as Volatility Brews
This month, while most of the crypto market grapples with intense volatility, some coins are presenting interesting technical setups: LEO holds steady amidst minor fluctuations, but Pi Network and Mantle are testing their lows with no clear recovery in sight. Each asset faces its own set of challenges, as bulls and bears jockey for control around key price levels. Will these coins overcome their current hurdles, or will remaining market pressures cause a deeper dive? Let’s break down the technical insights driving these intriguing dynamics.
UNUS SED LEO (LEO) Price Analysis
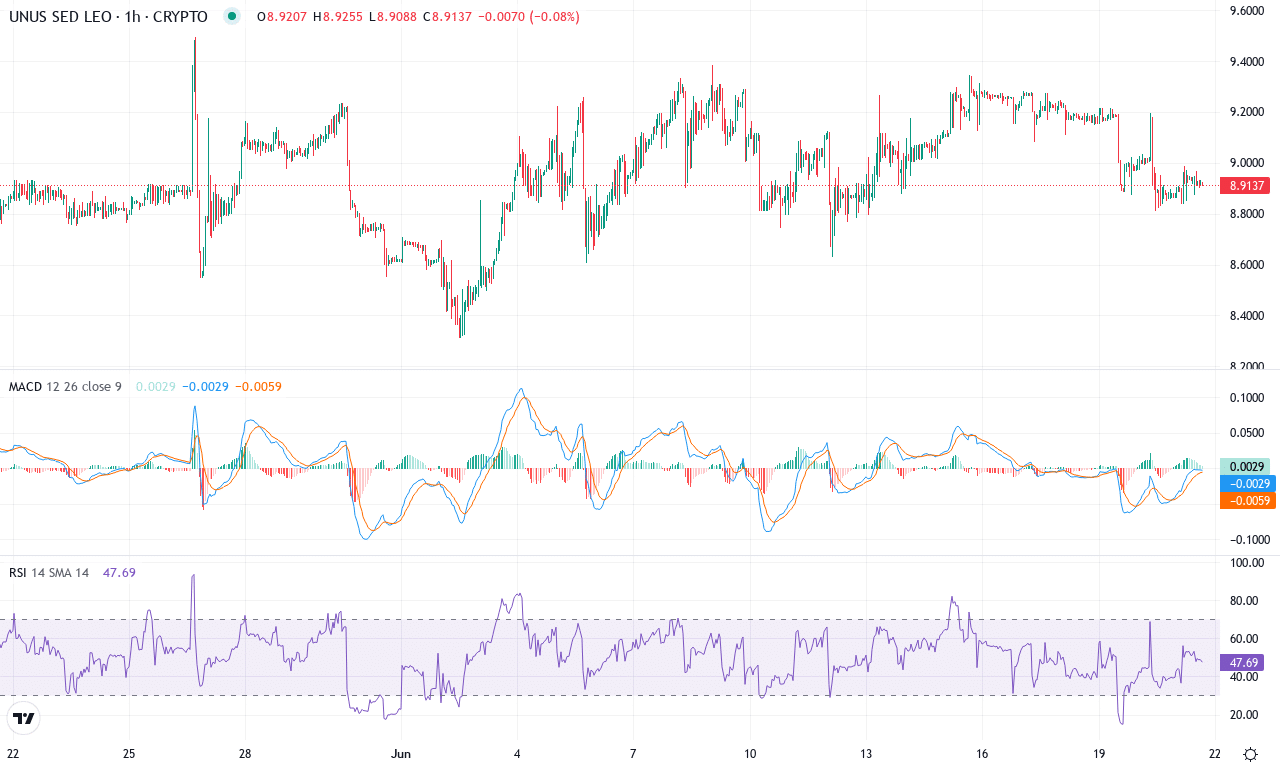
| Crypto | Close | 1W% | 1M% | RSI | ADX | MACD | CCI 20 | UNUS SED LEO(LEO) | $8.92 | -0.29% | 0.62% | 47.7 | 10.0 | 0.03 | -46.56 |
|---|
After months of outperforming the wider crypto market, UNUS SED LEO (LEO) is settling into a period of remarkable stability. While most altcoins have been caught up in whipsaw volatility, LEO has managed a modest 0.6% monthly gain and is virtually flat this week—suggesting traders are comfortable holding at these levels even as broader risk appetites wane. The yearly rally remains strong, still sitting on a robust 56% gain, but short- and medium-term momentum has clearly cooled off, with the three- and six-month charts showing consolidation and minor drawdowns. Right now, LEO is coiling just under $9.00, hugging its key moving averages and trading in the lower quadrant of last month’s range. For me, this type of price action signals a market in wait-and-see mode, where neither bulls nor bears have the conviction to push for a decisive move. It’s a tense calm—almost the quiet before the next storm.
On the technical front, the trend indicators remain constructive but lack the punch of recent bull runs. The weekly MACD line is flattening out, and oscillators are painting a picture of waning momentum—with RSI and other measures hovering in neutral territory. Price is sandwiched between closely aligned short- and long-term moving averages, underscoring the lack of directional urgency; this clustering often precedes breakouts but can sometimes drag on into deeper consolidation. The nearest psychological hurdle lies at $9.35, with monthly resistance looming just above at $9.50; a clean move above these levels could spark breakout momentum, unlocking upside toward the high $10s. Conversely, failure to hold $8.77—key short-term support—could trigger a slippery slide toward $8.05 and raise risks of a steeper correction. As trend strength slips and oscillators cool, I’m watching closely for volume surges or a decisive candle to set the next course—after this much calm, the ensuing volatility could be sharp and unforgiving.
Pi Network (PI) Price Analysis
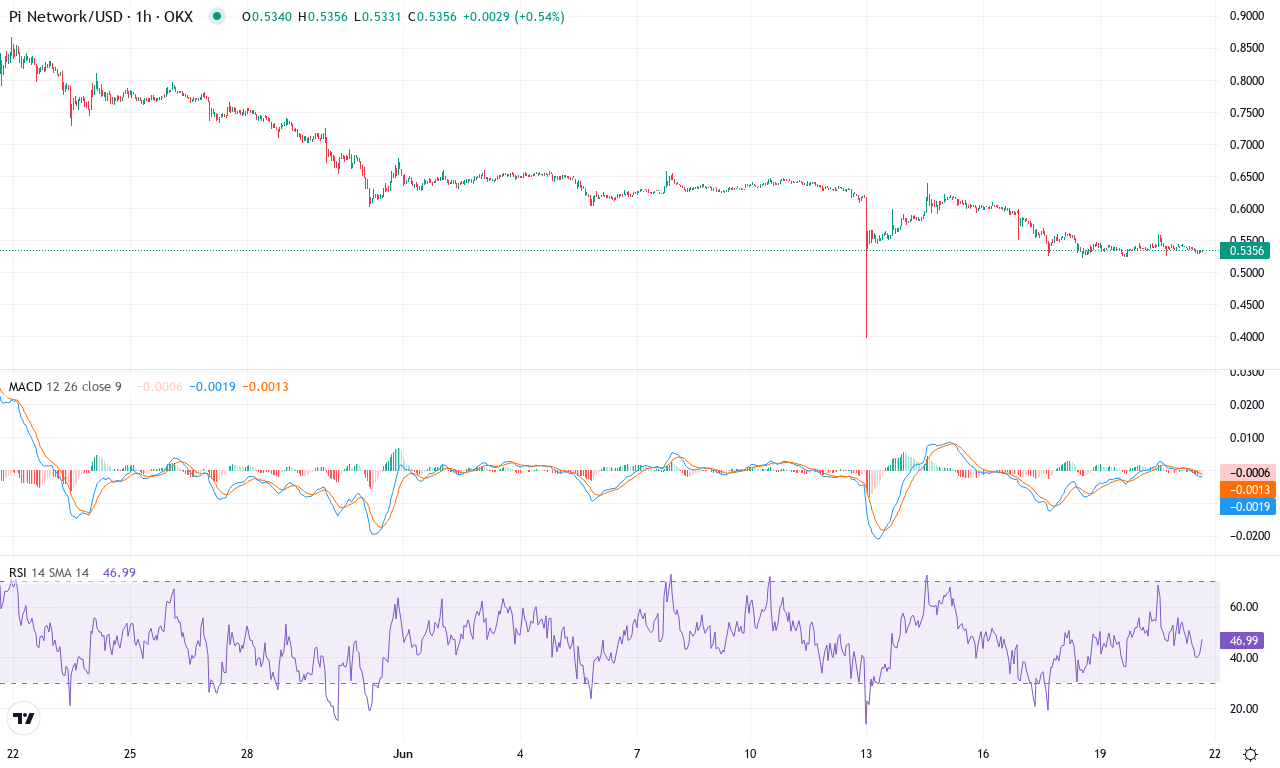
| Crypto | Close | 1W% | 1M% | RSI | ADX | MACD | CCI 20 | PI NETWORK(PI) | $0.54 | -8.49% | -36.80% | 31.8 | 26.6 | -0.05 | -112.40 |
|---|
After an extraordinarily volatile month, Pi Network is struggling to regain its footing. The token suffered a steep correction, tumbling nearly 37% over the last 30 days and extending its loss to over 46% in three months. Price action is currently hovering near $0.54—back toward the monthly lows—leaving the market in a defensive posture. As sellers pressed their advantage, support zones continued to slip, and attempts to reclaim higher ground above $0.80 fell flat. With such heavy downside momentum, it’s a time for caution, but dramatic reversals do sometimes erupt when volatility is this high—especially for a coin with Pi’s profile. If the bulls are hoping for a swift bounce back, they’re certainly going to have to fight for it.
The technical outlook backs up the recent pain, with trend indicators still pointing lower: the average directional index remains elevated, and sellers are firmly in control. The MACD line sits beneath its signal, showing no sign of fresh upward momentum yet. Oscillators tap into that sentiment too—RSI lingers close to the oversold range, and the momentum oscillator continues to show negative readings, suggesting exhausted buyers and a risk of further downside. On the moving average front, Pi trades below all key EMAs, undermining any short-term recovery hopes. The primary support zone hovers near the monthly low of $0.40—a breakdown there could trigger a fresh volatility surge toward $0.26, the next logical psychological level. If, however, bulls can reclaim control and push price back above $0.60–$0.63, a relief rally back to the $0.80 resistance comes into view. For now, all signs tilt toward added caution; if you’re still in the trade, keep your stops tight—nobody likes catching a falling knife.
Mantle (MNT) Price Analysis
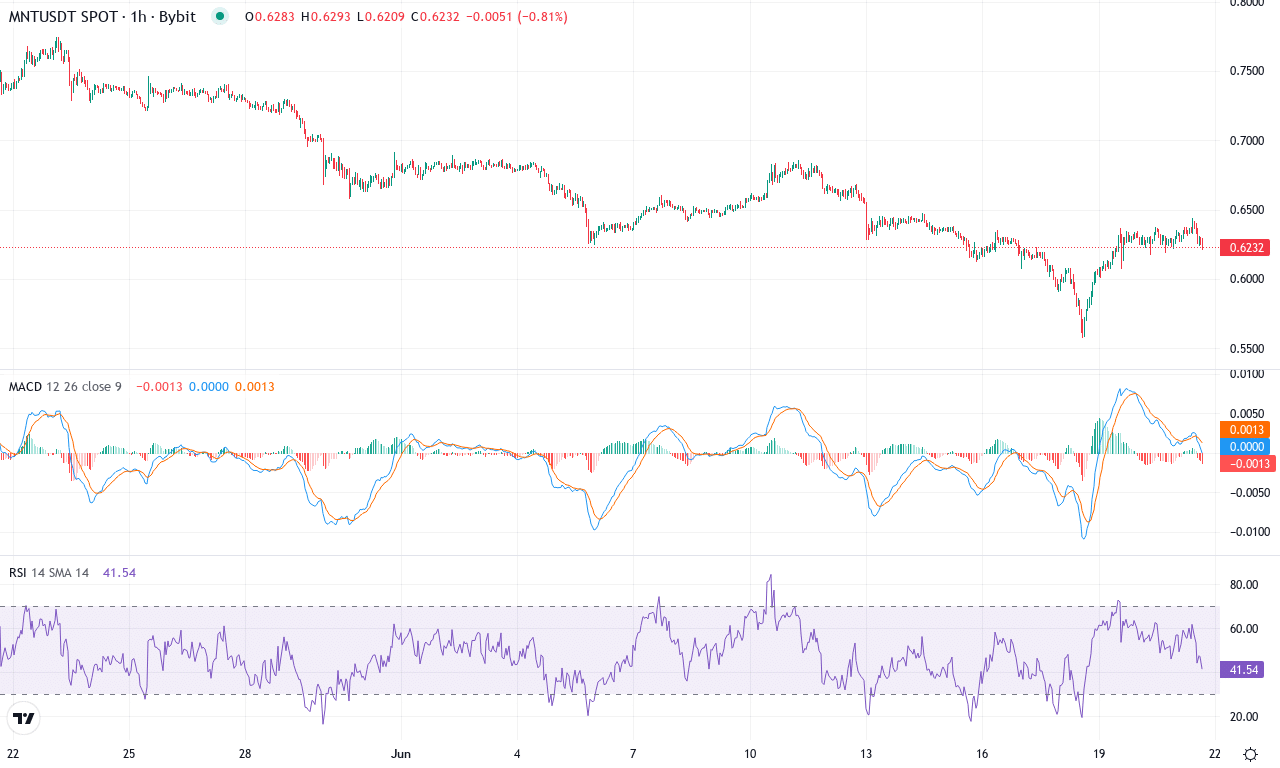
| Crypto | Close | 1W% | 1M% | RSI | ADX | MACD | CCI 20 | MANTLE(MNT) | $0.62 | -2.99% | -15.51% | 40.1 | 30.0 | -0.02 | -44.72 |
|---|
After a tough month marked by a sharp 15% pullback, Mantle is trading just above $0.62, caught between recovery attempts and persistent bearish momentum. The coin continues to show deep scars from the wide 3-month drop of over 21%, and the even steeper 6-month decline exceeding 46%. Weekly performance has been marginally negative, suggesting sellers still have a firm grip. Price action analysis reveals Mantle hugging its monthly lows, with the latest close lingering near significant support. The technical outlook suggests that downside risks remain elevated as bulls struggle to reclaim lost ground, and the lengthy period of profit-taking has kept buyers wary. If sentiment doesn’t shift soon, Mantle risks an extended fall toward the psychological $0.56 support. I have to admit—it’s nerve-wracking to see such protracted weakness in a market that’s known for its volatility surges.
Diving into the technicals, trend indicators confirm mounting bearish pressure. The ADX continues to flash a strong trend, while the negative directional index overwhelms the positive, underscoring that sellers remain in control. The MACD line is drifting below the signal, with both weekly and daily readings echoing a lack of positive divergence. Oscillators like the RSI and Ultimate Oscillator hover at subdued levels, failing to show any meaningful bounce, while momentum and oscillators remain pointed south. On the moving averages front, Mantle’s close is stuck below major short-term EMAs as well as its key 200-day average, a classic sign that rallies are likely to be capped. Immediate resistance sits near $0.68—right in line with the lower EMA band; clearing this zone could spark a relief rally toward $0.73. However, failure to hold the $0.62–$0.60 zone might invite a steep correction down to $0.56. Unless we see a dramatic shift soon, all signs point to further tests of lower support—and as always, don’t forget, you’re not in the red until you sell.
Will Stability Persist or Will New Lows Emerge?
LEO continues its balanced trade, holding firm as volatility pressures others. Meanwhile, both Pi Network and Mantle are navigating their critical support zones, with recent actions hinting at potential downward pressure. The coming sessions will determine if stability can be maintained or if these assets will break to new lows — traders are tuned in for directional signals.