BNB, Solana, and Cardano Teeter at Make-or-Break Supports as Bearish Momentum Escalates
As the crypto market braces for another round of volatility, BNB, Solana, and Cardano are caught in a precarious dance at major support levels. BNB has given up 7.8% of its value in the past month, teetering above a critical pivot, while Solana’s 25% slump has added to the air of uncertainty. As these assets flirt with what could be pivotal moments, investors are left questioning whether we’ll see a surge back to bullish territory or if we’re on the edge of deeper declines. Let’s break down the technical setup across the board to understand what might unfold next.
BNB (BNB) Price Analysis
| Crypto | Close | 1W% | 1M% | RSI | ADX | MACD | CCI 20 | BNB(BNB) | $632.60 | -2.09% | -7.81% | 40.0 | 17.2 | -4.63 | -150.22 |
|---|
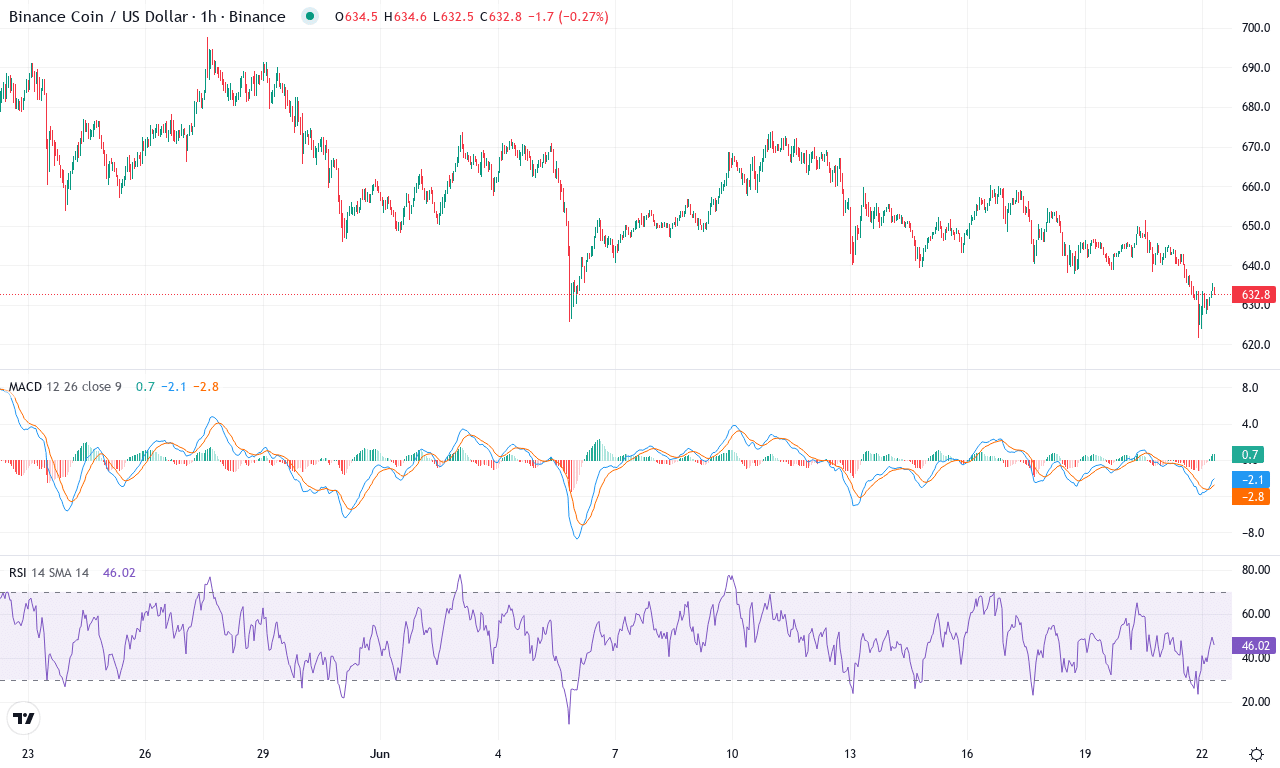
After a month marked by indecision and choppy price action, BNB finds itself under mounting pressure, recently slipping toward the lower end of its monthly range. The token posted a 7.8% loss over the last month, erasing previous gains and reflecting the broader market’s cautious risk appetite. Despite a fleeting upside attempt earlier in the quarter, BNB’s technical outlook suggests that bullish momentum is fading, with sellers regaining control as volatility surges. The close at $632.60 sits just above key support at $621.50—the last major pivot before a steeper correction looms. As headwinds grow, I’m watching for any signs of a reversal, but for now, the downside scenario can’t be ignored. Frankly, if BNB loses $620 with conviction, brace for heavier selling—it’s a level I’ll be defending with caution.
Diving into the technicals, trend indicators show a definitive shift: the average directional index signals a strong trend, but negative pressure is dominating, and oscillators echo that downside momentum is building. The weekly MACD, which had previously signaled a faint bullish crossover, is now rolling over—classic warning signals of trend exhaustion. Oscillators, including RSI, remain just above neutral but are drifting lower, while momentum and the Awesome Oscillator have flipped negative across timeframes. Price action analysis reveals BNB is trading below its short-term moving averages and is struggling to reclaim the $645–$650 area—a psychologically important resistance band. If bulls manage to reclaim $650, a push back toward $709 becomes plausible, but without that, the path of least resistance is down. Should support at $621 fail, watch for potential long liquidations that could drive price swiftly toward $596 or even $533—levels in play if bearish momentum accelerates. There’s tension in the air; every close below support tightens the noose on bull hopes, and only a sharp reversal can invalidate the bearish thesis now.
Solana (SOL) Price Analysis
| Crypto | Close | 1W% | 1M% | RSI | ADX | MACD | CCI 20 | SOLANA(SOL) | $134.95 | -6.80% | -24.85% | 33.6 | 18.8 | -5.73 | -172.14 |
|---|
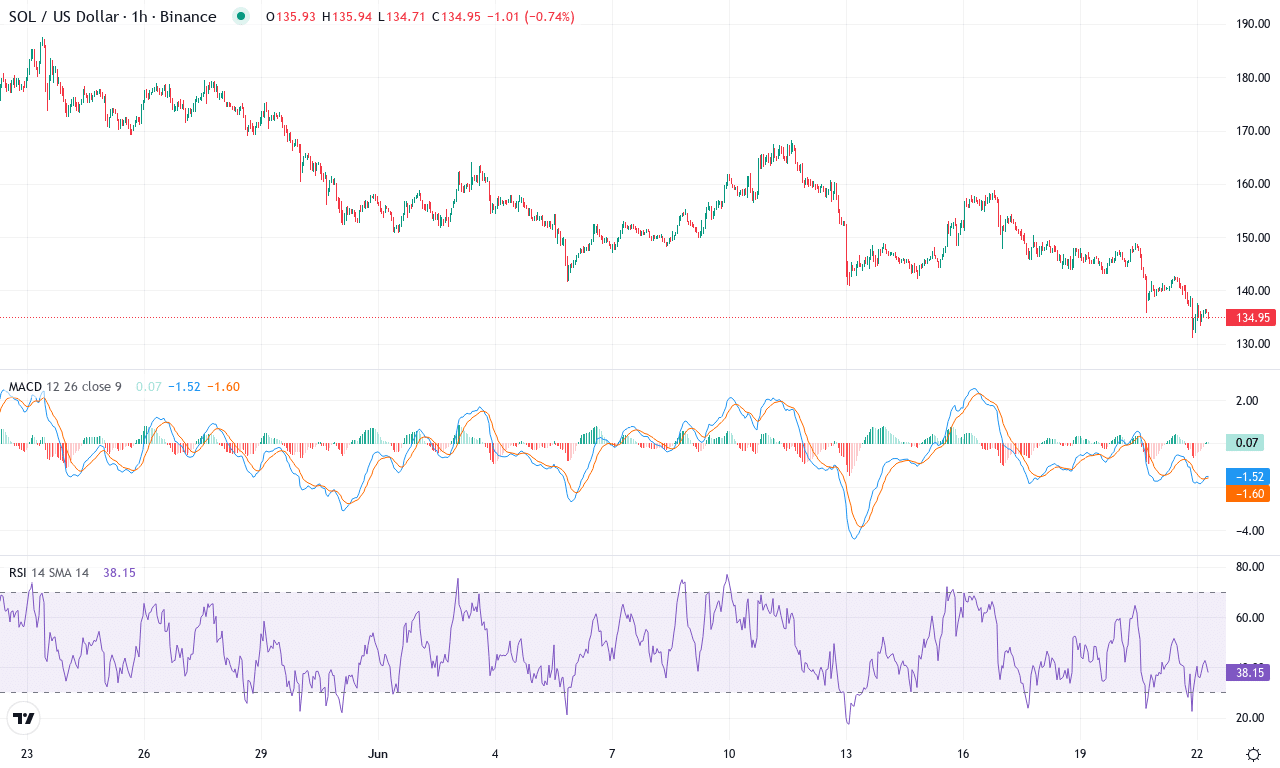
After a meteoric Q1, Solana is now weathering a sharp pullback, having plummeted nearly 25% over the past month and slipping to $134.95—a stark reversal from its recent high of $179.48. The weekly performance remains negative, and what’s striking is the magnitude of volatility Solana traders are enduring lately. Having underperformed the broader market, the technical outlook suggests a battle for control between exhausted bulls and increasingly confident bears. With this sort of correction on the heels of a powerful upward march, many are wondering: has Solana’s bull run hit a wall, or is this just a dramatic pause before another leg up?
Diving into the charts, trend indicators reflect weakening bullish momentum; the average directional index is climbing, but with the negative directional reading dominating, bears have clearly seized short-term control. The MACD continues to drift deeper into negative territory, with a pronounced bearish crossover signaling the momentum is firmly to the downside. Oscillators like RSI and the CCI are mired in oversold territory, hinting that a technical bounce could materialize if sellers exhaust themselves—but there’s no clear reversal signal yet. Price action is now well below all relevant moving averages, underscoring the risks of an extended fall, especially if support at $130.99 is broken. Should bulls muster a comeback and reclaim $155, a relief rally toward $182 is possible; but if the floor cracks, Solana may tumble toward its multi-month lows near $115. Stay nimble here—momentum can shift fast in these high-volatility conditions, and I’ll admit, I’m anxious to see who blinks first at this make-or-break level.
Cardano (ADA) Price Analysis
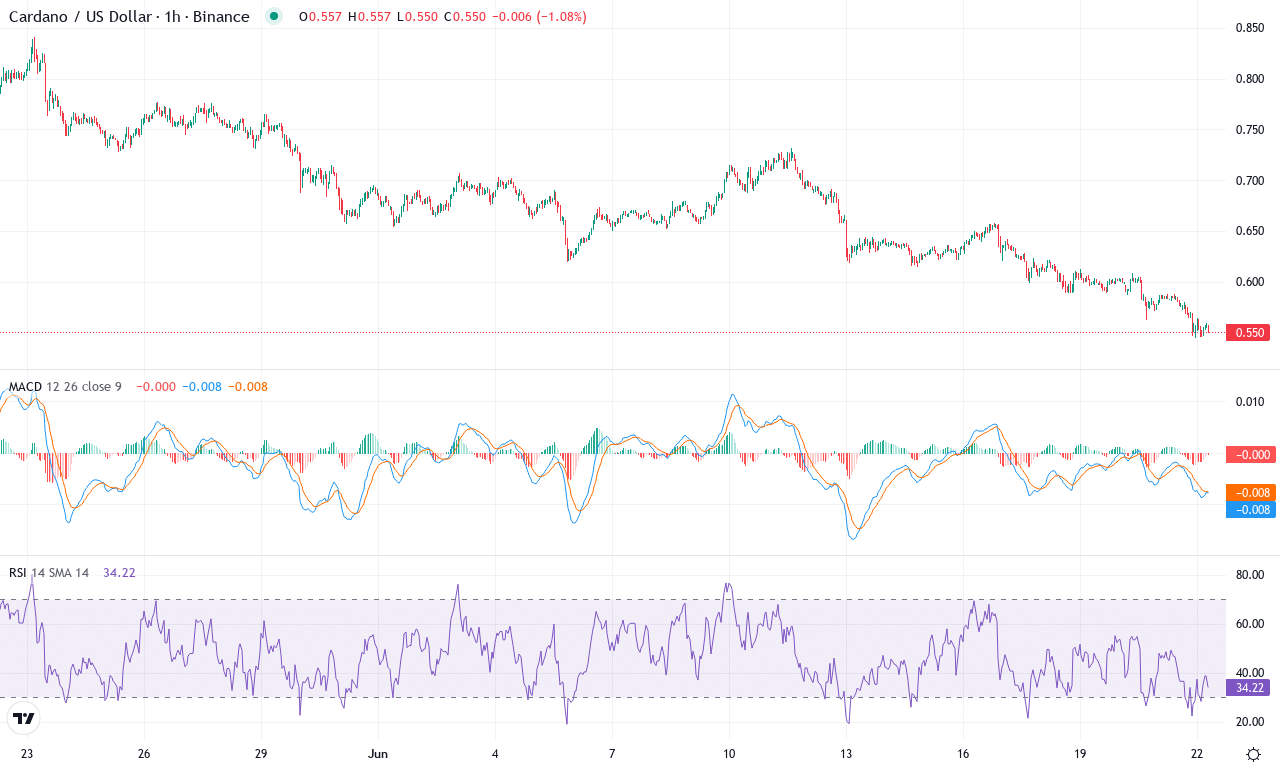
| Crypto | Close | 1W% | 1M% | RSI | ADX | MACD | CCI 20 | CARDANO(ADA) | $0.55 | -11.98% | -31.89% | 26.4 | 23.1 | -0.04 | -165.12 |
|---|
Cardano has stumbled into a critical inflection point after a punishing month, shedding nearly 32% and dragging traders through a sharp correction from highs near $0.78 down to the $0.54 range. Having bled off over 40% in the last six months, bearish momentum is palpable, with the price now hovering around $0.55—firmly beneath key moving averages and psychological support zones. After such a relentless selloff, I can’t help but feel uneasy; Cardano bulls have been battered, and the path to recovery looks increasingly arduous unless sentiment shifts. The technical outlook suggests sellers remain in control, underscored by a recent 12% weekly slide and failure to reclaim lost ground. Unless buyers find their footing soon, risks of an extended fall remain front and center.
Drilling into the technicals, trend indicators are leaning heavily bearish—Cardano’s directional movement gauge shows sellers dominating, while ADX readings reflect a strong, established downtrend. The weekly MACD is ticking lower, with both the signal line and MACD line failing to cross upward, which typically signals that bearish momentum isn’t exhausted yet. Momentum oscillators and RSI confirm the theme, both anchored in neutral-to-oversold territory—further downside wouldn’t be surprising given this setup. Price action sits entrenched below all major exponential moving averages, keeping the rally dreams at bay. For scenario planning: if Cardano manages even a modest bounce above the $0.60-$0.65 resistance cluster, a move toward $0.73 may attract opportunistic buyers; but if the bulls get squeezed out and $0.54 fails to hold, prepare for a plunge toward the next support at $0.51. Personally, I’m worried here—major confirmation from volume and reversal signals are needed before anyone should consider Cardano out of the woods.
Testing Support: Which Way Next?
BNB remains above its crucial level, struggling to regain footing, while Solana hovers at a make-or-break juncture, awaiting directional clarity. Cardano’s support is being tested as bearish sentiment looms. Should these supports hold, a revival could be on the horizon; however, a breach could usher in further downside. Traders will be watching for signs of stabilization or renewed pressure to guide their next moves.