Litecoin, Bitcoin Cash, Zcash, and Compound Coiled as Bulls Eye Breakout Triggers Amid Healing Sentiment
Litecoin, Bitcoin Cash, Zcash, and Compound are showing signs of gathering strength after months of decline, as recent gains hint at potential reversals. Litecoin, despite a modest weekly uptick, finds itself at critical support and resistance junctures, suggesting a decisive move could be imminent. Meanwhile, Bitcoin Cash is testing resistance near $420, where a breakthrough might reignite its bullish trajectory. Zcash, following a sharp rally, teeters near a significant resistance zone at $57, with an impending breakout possibly on the cards. Compound, rallying from recent lows, demonstrates fresh momentum but faces formidable resistance ahead, leaving traders on edge. Let’s take a closer look at the signals behind these moves.
Litecoin (LTC) Price Analysis
| Crypto | Close | 1W% | 1M% | RSI | ADX | MACD | CCI 20 |
|---|---|---|---|---|---|---|---|
| LITECOIN (LTC) | $88.64 | 3.42% | -1.01% | 45.7 | 19.1 | -1.80 | -67.19 |
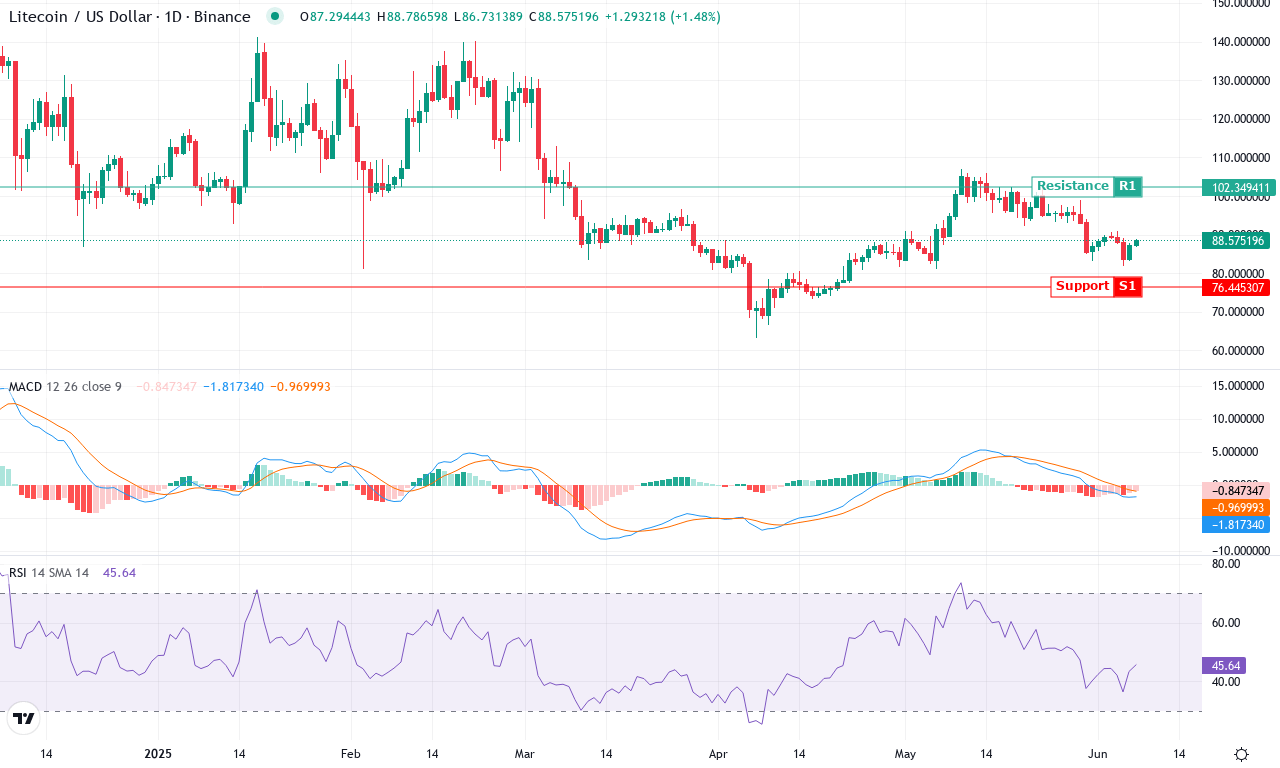
After a bruising multi-month decline, Litecoin appears to be searching for a bottom, grinding out a modest 3% gain on the week despite a downbeat -1% performance for the month. That’s not enough to trigger euphoria, but it does hint that bullish momentum could be gathering beneath the surface after the coin’s painful 34% slide over the last six months. Traders will recognize that Litecoin’s price is currently hovering well above its recent monthly low near $82, yet remains far from reclaiming last month’s high of $107. For now, price action hangs just below the $90 mark—perched at a psychological and technical crossroads, where both bulls and bears are poised for the next decisive move.
Technically, the trend indicators reveal a market trying to claw its way out of oversold territory, albeit with mixed signals. The ADX reads strong trend conditions, yet the negative directional index continues to outpace the positive—bearish undertones persist. MACD lines on higher timeframes are still in negative alignment, but the histogram shows recent contraction; bears are losing their grip, and a bullish crossover could materialize if upward pressure continues. Momentum oscillators and RSI both scrape along neutral to low levels, suggesting the market is not yet overbought—setting the stage for a potential relief rally. Critically, Litecoin straddles a key support zone in the mid-$80s, with resistance looming at $94 and major overhead resistance near $102. If buyers drive prices back above the $94 threshold, momentum could accelerate toward $102 and higher—but a decisive break below $82 exposes risks of an extended fall. Personally, if we see a firm move through $94 with volume, I’d be ready for some fireworks. As always, nimble adjustment is key: a close below recent support would invalidate any bullish thesis and likely signal another leg down.
Bitcoin Cash (BCH) Price Analysis
| Crypto | Close | 1W% | 1M% | RSI | ADX | MACD | CCI 20 |
|---|---|---|---|---|---|---|---|
| BITCOIN CASH (BCH) | $407.68 | 2.13% | 6.16% | 52.6 | 20.2 | 1.85 | -29.93 |
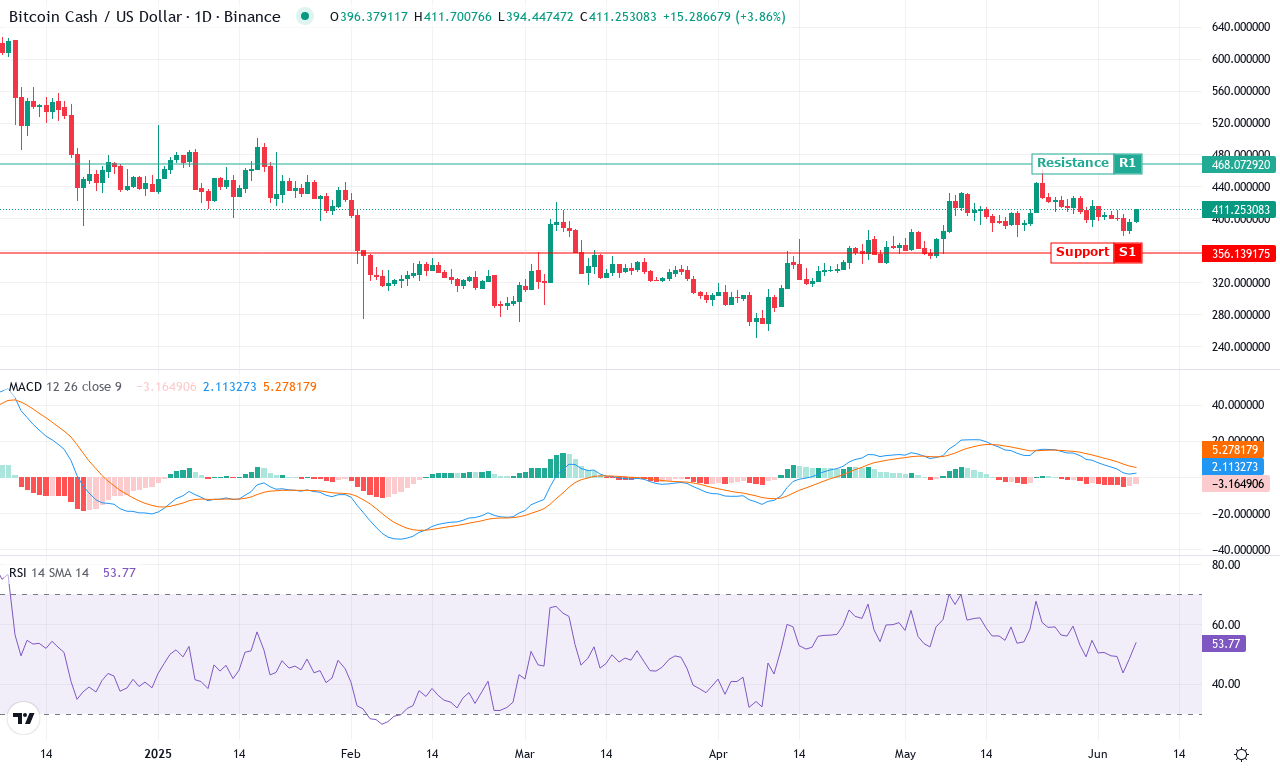
After a challenging six months marked by a steep correction, Bitcoin Cash is starting to regain its footing. The past week delivered a modest advance of just over 2%, extending a monthly upswing to more than 6%—a welcome respite for traders bruised by last quarter’s heavy drawdown. BCH’s price recently bounced from a monthly low near $376, climbing towards $408 on improving sentiment and a broad-based bid for large-cap altcoins. However, relative underperformance versus Bitcoin year-to-date still lingers, and it’s clear that bulls are facing a test at every turn as overhead supply remains stubborn near recent highs. If you held through the turbulence, it’s time to pay close attention—price action is crowding against the $420 zone, whose breach could finally shake BCH from its months-long malaise.
Technically, the outlook is tilting cautiously bullish. Trend indicators are perking up: the Average Directional Index has jumped above 20, suggesting momentum is finally building. The MACD line remains in positive territory and is accelerating higher over the weekly window, while supporting oscillators—like the Awesome Oscillator and momentum metrics—hint that the tide may be turning in buyers’ favor. BCH is holding steady above its short-term moving averages, and sits on top of key 10-, 20-, and 30-day EMAs, foreshadowing continued upward pressure. The $420–$430 region is shaping up as the next hurdle, with classic resistance at $468 and a big psychological barrier overhead at $500—my heart always races when price closes in on these round numbers. If sellers push back and BCH loses the $390 support, brace for a retreat toward the $380 band, where long liquidations could accelerate a sweep of lower stops. For now, all eyes are locked on whether bulls have the conviction to flip resistance and unlock breakout momentum.
Zcash (ZEC) Price Analysis
| Crypto | Close | 1W% | 1M% | RSI | ADX | MACD | CCI 20 |
|---|---|---|---|---|---|---|---|
| ZCASH (ZEC) | $48.64 | 2.64% | 20.13% | 52.1 | 31.0 | 2.07 | -23.97 |
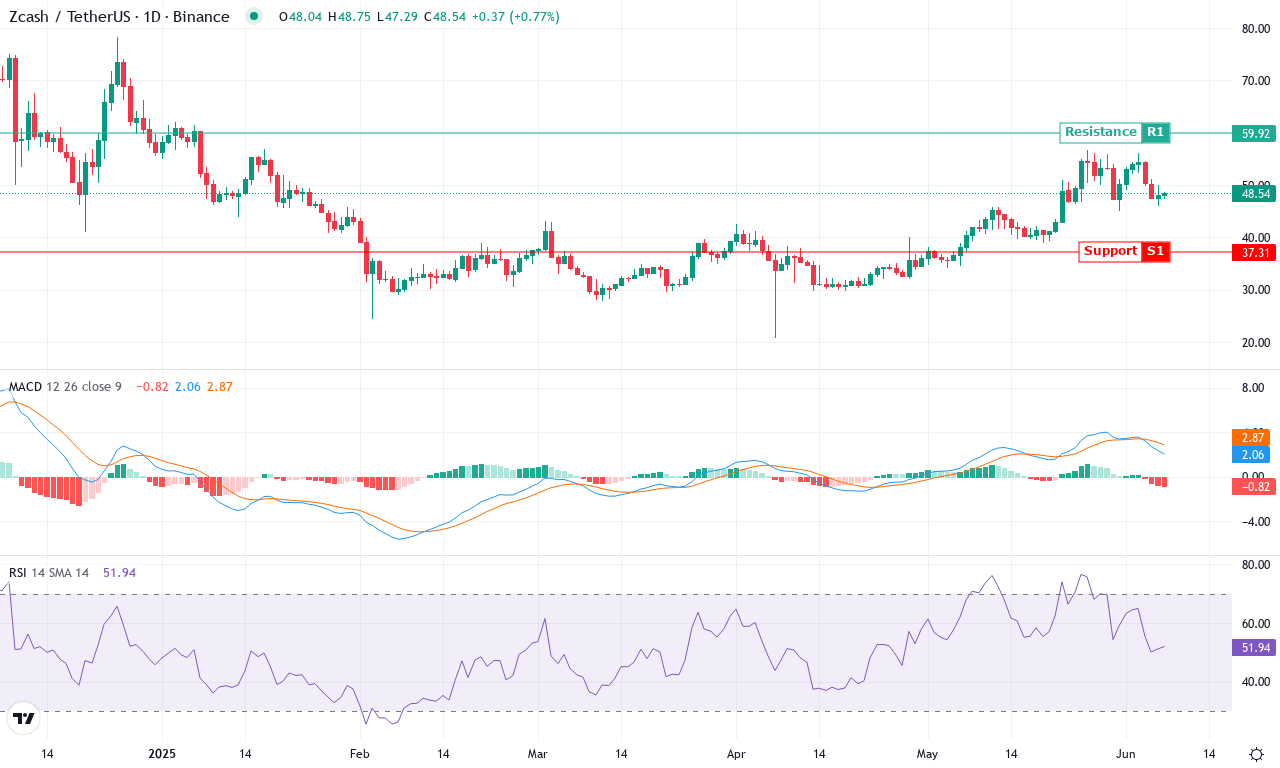
After a blistering 20% monthly rally, Zcash is making waves again, snapping its prior downtrend with conviction. The latest surge has pushed the price to $48.64—squarely within the recent upper quartile after touching a monthly high near $57. The broader context is compelling: in the past three months, ZEC is up nearly 50%, recapturing the attention of traders hunting volatility. Yet, despite this explosive recovery, the longer six-month view underscores risk—Zcash remains well below its yearly peak, reminding us how brutally oscillating these altcoin cycles can be. Right now, the technical outlook suggests bullish momentum is building, with price punching above key moving averages and threatening to reclaim a major resistance area around $56. If bulls can break through that barrier, I expect a volatility surge with eyes on $60 and beyond. Frankly, after watching ZEC languish last quarter, this comeback feels downright cathartic.
Peeling back the charts, trend indicators are skewing bullish: the average directional index reads strong, with positive directional movement handily outpacing negatives—a classic sign that bulls are regaining control. The weekly MACD continues to accelerate above its signal, and oscillators such as the RSI are pushing north of 56 but shy of overbought extremes, signaling room for further upside. ZEC’s price action is now firmly above all major exponential moving averages, with the 10- and 20-period EMAs curling higher and acting as dynamic support around $49–$48, respectively. The looming hurdle is the $57 resistance zone; a convincing breakout could catalyze follow-through to the psychological $60 level. On the flip side, failure here would open the door for profit-taking and a potential slide back to support in the $44–$41 region. For now, all signs point to a market preparing for a breakout—but remember, in this business, expectations are meant to be challenged. Buckle up.
Compound (COMP) Price Analysis
| Crypto | Close | 1W% | 1M% | RSI | ADX | MACD | CCI 20 |
|---|---|---|---|---|---|---|---|
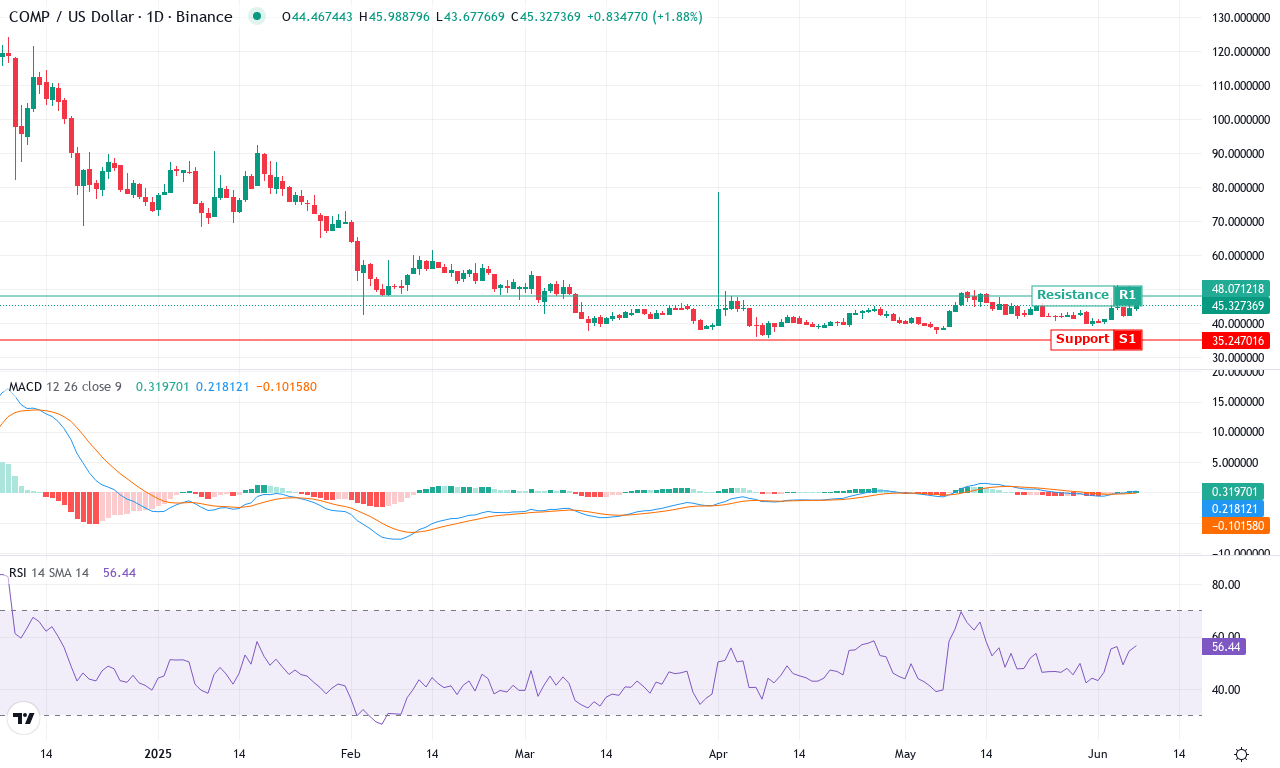
| COMPOUND (COMP) | $45.39 | 13.50% | 16.04% | 56.6 | 20.5 | 0.22 | 102.75 |
After weeks of sharp declines and an intense shakeout, Compound (COMP) is showing rare signs of life. The token surged over 16% this month and gained 13% in the past week, snapping a brutal multi-month downtrend that saw it lose more than 60% in the last six months. This rebound off a monthly low near $39 is drawing traders back in, elevating hopes that a base is finally forming. Even so, the legacy of that drawdown looms large—COMP remains far below its yearly highs, highlighting that bullish conviction is still fragile. With price action stalling just above $45 and resistance looming at the $51 zone, the technical outlook remains ambivalent: recovery hopes are climbing, but risks of another steep correction haven’t fully faded. Cautious optimism is in the air, but don’t get complacent—volatile reversals are always just one headline away.
Diving into the technicals, trend indicators have strengthened: the ADX is elevated, suggesting the emerging momentum may have some legs. Bulls have wrestled control, as positive directional movement leads, but the MACD profile still shows conflicting signals—while the MACD line just flicked back above its signal, both remain near flat, reflecting fresh but tentative upside. Meanwhile, the RSI has clawed its way back into neutral territory near 56, tempering overbought concerns and signaling there’s room for continuation. COMP is now trading right at key short-term averages; a push above the $51 resistance could quickly open the door to the $55–$68 range, where profit-taking could amplify volatility. However, failure to sustain these gains may invite sellers back—with first important support at $42 and deeper risk toward the recent $39 floor. All signs suggest traders should brace for turbulence; I’ll be watching for a breakout confirmation, but I’ll also have my stop-loss tight—Compound isn’t a place for the faint-hearted just yet.
On the Verge of Breakouts?
Litecoin’s current position at key levels suggests a pivotal decision point, while Bitcoin Cash’s test of $420 could catalyze its next upward leg. Zcash flirts with $57 resistance, where a successful breach might confirm continued bullish momentum. Compound’s fresh rally energy needs to surmount nearby resistance to sustain its advance. As sentiment heals, traders should watch for confirmed breakouts to validate the bulls’ conviction.