Solana Stalls at Crucial Support as Aave Bulls Eye Breakout Beyond $300
Solana’s recent performance has met with a pivotal support zone after an impressive 30% rally, shedding momentum in the past month as traders brace for potential volatility. As it hovers around critical levels, the question remains whether bulls can defend territory or if a deeper pullback is on the horizon.
Solana (SOL) Price Analysis
| Crypto | Close | 1W% | 1M% | RSI | ADX | MACD | CCI 20 |
|---|---|---|---|---|---|---|---|
| SOLANA (SOL) | $155.73 | -1.28% | -9.86% | 46.4 | 22.2 | -3.41 | -58.21 |
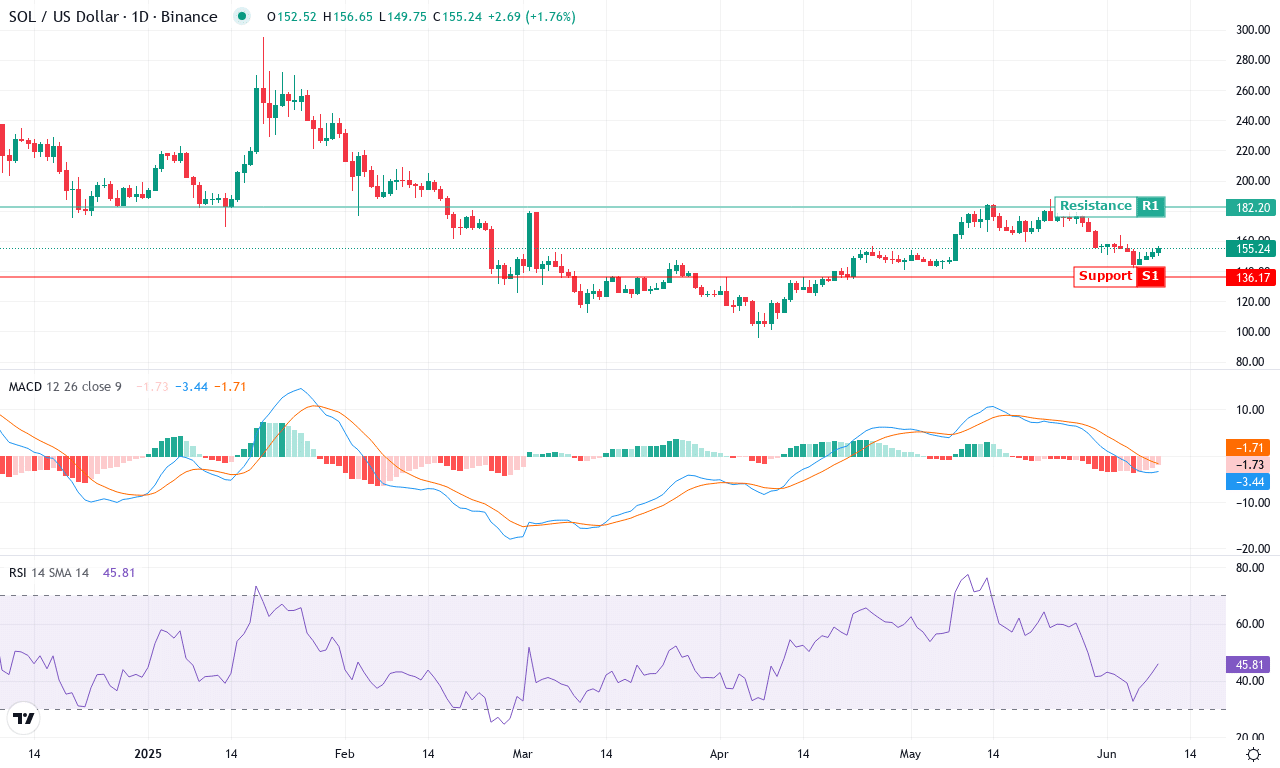
After a blistering rally that saw Solana surge over 30% in the last three months, price action has taken a sharp turn, with the token shedding nearly 10% over the past month. The market mood has cooled dramatically—short-term traders are clearly wrestling with whiplash as SOL gave up recent highs near $188 and settled closer to the $155 zone. Despite a stellar quarter, Solana is struggling to hold its footing, and with the broader crypto sphere facing some turbulence, the technical outlook suggests a period of re-evaluation is at hand. Those who rode the wave up are now eagerly watching for stability; if you’re looking for volatility, Solana rarely disappoints.
Digging into the technicals, trend indicators still show underlying strength—ADX remains elevated, with positive trend signals outshining the negative despite the recent downturn. The weekly MACD is in negative territory, but momentum oscillators are flashing mixed vibes: the RSI is trending well below overbought conditions, signaling some reset, while the stochastic readings are correcting from extremely frothy levels, reflecting heavy profit-taking. Currently, SOL is hovering around its 10-day and 20-day EMAs, and sitting just above a major support cluster near $150—a zone I’m watching like a hawk. If bulls can defend this area and push through resistance at $162, the next upside target emerges around $182; fail here, and risks of a steep correction back towards the $136 support cannot be ignored. With Solana’s history of volatility, keep your stops tight—this market doesn’t reward hesitation.
Meanwhile, Aave’s upward momentum shows little sign of waning as it approaches the significant $300 mark, suggesting a potential breakout but with risks of profit-taking lurking. Will the bulls march forward or face a dose of reality? Let’s break down the technical setup across the board.
Aave (AAVE) Price Analysis
| Crypto | Close | 1W% | 1M% | RSI | ADX | MACD | CCI 20 |
|---|---|---|---|---|---|---|---|
| AAVE (AAVE) | $260.09 | 5.50% | 23.21% | 57.8 | 26.0 | 9.12 | -0.83 |
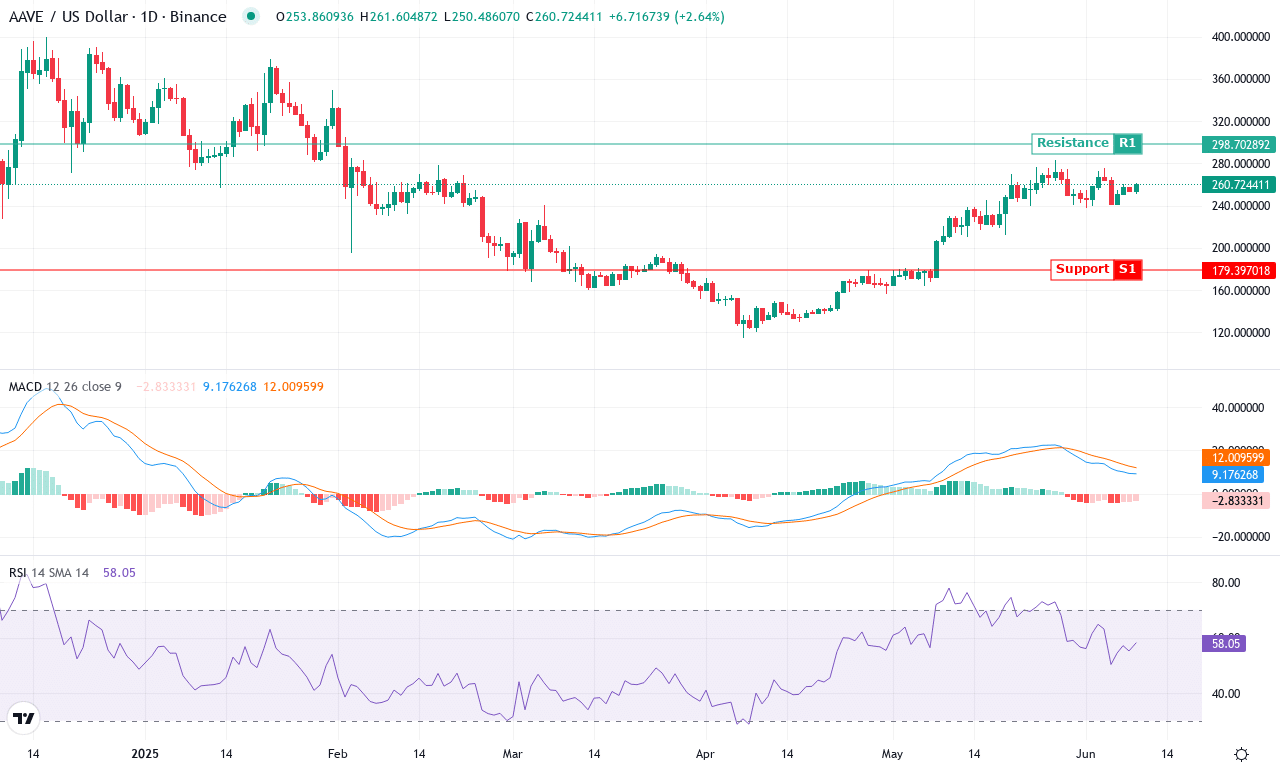
After a multi-week rally that saw Aave surge over 23% in the last month and notch an impressive 44% gain over three months, the DeFi blue chip now rests just under its monthly high at $260. With performance vastly outperforming broader markets and closing well above all major moving averages, bullish conviction is unmistakable—though traders now face the classic dilemma: press for further upside, or brace for profit-taking and heightened volatility? The technical outlook suggests that after such a meteoric run, the market is pausing, but key signals argue this pause may only be a springboard for a fresh leg higher if momentum persists.
Trend indicators are flashing green across the board. The average directional index signals strong trend strength; positive directional indicators are firmly above negative, confirming bulls are calling the shots. The weekly MACD shows acceleration, and the histogram hints at swelling bullish momentum—both confirming that underlying forces are aligned for further upside. RSI hovers near elevated levels but hasn’t tipped into severe overbought territory, which suggests that while there’s heat, Aave isn’t yet flashing a major sell signal. Price action analysis shows Aave pushing decisively above its 10-day and 20-day exponential moving averages, with the nearest resistance perched near $300—a psychological round number and a previous rejection zone. If bulls clear $300, the next price target climbs toward the $350 region, intensified by layered resistance near $351. On the downside, if sellers regain control, look first for a pullback to the $230 support area; a steeper correction could test the high-200s EMAs. Personally, I’m keeping a close eye on how Aave handles $300—if it pops, I’d be thrilled, but as always, never ignore the risk of an extended fall after such parabolic moves. Stay nimble.
Can Solana Hold the Line?
Solana inches precariously close to its support, where bulls must fortify or risk a bearish turnaround. Meanwhile, Aave edges toward the $300 threshold, with the potential breakout hinging on maintaining upward pressure. Traders are advised to watch these critical junctures for signs of direction — whether it’s a continuation of the current trends or unexpected reversals.