HYPE And OKB Coil Below Key Resistance As Bulls Test Limits Of Momentum
HYPE and OKB are finding themselves at a critical juncture following impressive multi-month gains, including a recent surge of 52% for HYPE this past month alone. Yet, as both assets hover just below significant resistance levels, bullish momentum faces a precarious test with volatility poised to spike. The big question: can this momentum carry through, or will bulls encounter exhaustion at these psychological barriers? Let’s break down the technical setup across the board.
Hyperliquid (HYPE) Price Analysis
| Crypto | Close | 1W% | 1M% | RSI | ADX | MACD | CCI 20 |
|---|---|---|---|---|---|---|---|
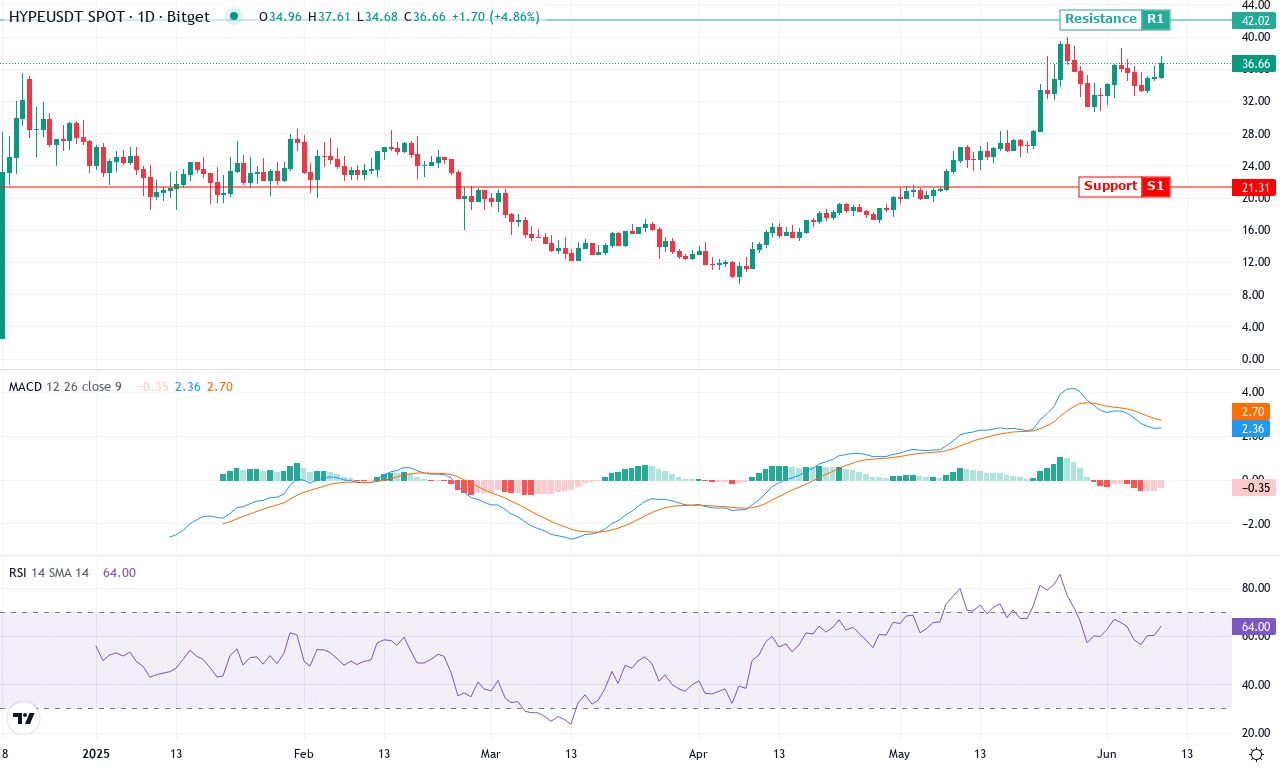
| HYPERLIQUID (HYPE) | $37.40 | 9.58% | 51.97% | 65.4 | 41.5 | 2.41 | 87.74 |
After an explosive three-month rally of over 175%, Hyperliquid (HYPE) has taken center stage among altcoins, surging 52% in the past month alone and notching a fresh monthly high near $40. This dramatic run has not only catapulted HYPE into the spotlight but also drawn in waves of speculative and institutional interest, all gunning for breakout momentum. Bulls are clearly in control—this week’s nearly 10% gain signals that the relentless bid isn’t fading just yet. But with price now hovering just below major psychological territory at $40, volatility is primed to surge, and the next decisive move could shape sentiment for weeks. I’ll admit, after such an epic ascent, even seasoned traders like myself feel an adrenaline kick watching HYPE coil with this much energy.
Technically, the outlook remains tilted in favor of the bulls—trend indicators are ringing with strength, as the ADX resides deep in trending territory while the positive directional index continues to outpace its negative counterpart. The weekly MACD is accelerating, and with momentum oscillators still rising, buyers retain the upper hand. HYPE’s price is grinding well above all key moving averages, a classic sign of sturdy bullish momentum, while support levels crowd the mid-$30s—a zone to monitor closely if a steep correction ever materializes. If bulls can vanquish the $40–$41 resistance band, there’s little overhead supply until the $45 mark, potentially setting the stage for another wave of upside. Conversely, if profit-taking erupts or buyers finally exhaust, expect a potential retrace towards $32 support. RSI and fast stochastic readings warn of mounting overbought pressures, so don’t chase blindly—risk management here is crucial. One thing is clear: all signs point to a pivotal showdown ahead, with emotion and conviction fueling every candle.
OKB (OKB) Price Analysis
| Crypto | Close | 1W% | 1M% | RSI | ADX | MACD | CCI 20 |
|---|---|---|---|---|---|---|---|
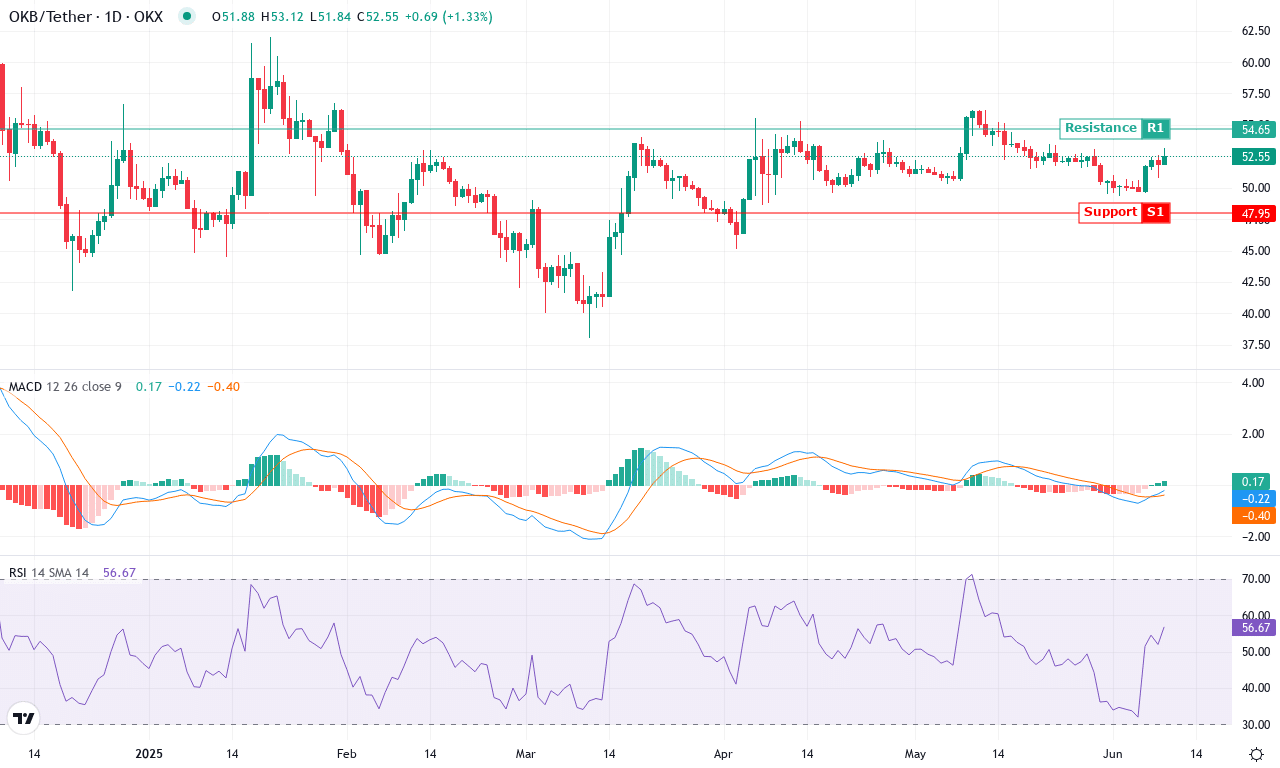
| OKB (OKB) | $52.46 | 4.71% | -5.73% | 56.2 | 12.5 | -0.23 | 70.25 |
After a stellar Q1, OKB’s price action is now navigating rougher seas. June saw bulls attempt a fresh rally, only to be met with resistance just below $56.20, while the monthly low at $49.34 acted as a firm support base. Last week’s bounce—up nearly 5%—offers a ray of hope following May’s disappointing -5.7% performance. Despite the broader market’s volatility surge, OKB remains resilient, anchored by a healthy yearly gain over 10%. The technical outlook suggests the coin is locked in a tug-of-war: momentum indicators are flashing mixed signals, but the sustained bid above $52.00 hints that institutional demand hasn’t vanished just yet. If OKB can reclaim—and hold—its recent highs, I wouldn’t be surprised to see momentum swell and buyers step in more decisively.
Diving deeper, trend indicators show moderate strength: OKB’s ADX reading confirms an established trend, albeit with positive directional lines only marginally above the negative. The weekly MACD, once energizing, now signals mild bearish divergence as its histogram flattens and the line dips. RSI flirts with the mid-50s—not overheated but far from oversold—while oscillators like the Awesome Oscillator and CCI are inconclusive, suggesting the current move lacks runaway conviction. On moving averages, OKB clings above its 10-day, but hovers less than a dollar from its 50- and 100-day lines, reinforcing this no-man’s-land. The $56 level stands out as a psychological hurdle and clear resistance; a breakout above this would target the next pivot at $65, where a FOMO rally could unfold quickly. On the downside, failure to hold $51 calls for caution—risks of a steep correction to $48 grow if sellers regain control. Personally, I’d stay nimble here: OKB’s setup is balanced on a knife’s edge—be ready for fireworks in either direction.
Will Bulls Sustain the Charge?
HYPE holds steady beneath its resistance, showing signs of potential consolidation if it fails to break above. OKB, meanwhile, is edging closer to its own critical level, where a successful breach could spark further gains. The outcome hinges on maintaining momentum; traders should watch for volume spikes or reversal patterns to gauge the next moves.