BitcoinCash And Hyperliquid Bulls Square Off With Resistance As Momentum Reaches A Boiling Point
Bitcoin Cash and Hyperliquid have captured traders’ attention with striking performances amidst the market’s tumultuous backdrop. Bitcoin Cash’s 9% weekly surge positions it tantalizingly close to significant resistance at $431.90, while Hyperliquid’s explosive 67% monthly ascent has it flirting with its $44 monthly high. Both assets seem primed at a critical juncture where the bullish narrative could either reinforce their upward trajectory or face a reality check. Will these surges break through resistance or yield under pressure? Let’s delve into the technical indicators to unpack what’s coming next.
Bitcoin Cash (BCH) Price Analysis
| Crypto | Close | 1W% | 1M% | RSI | ADX | MACD | CCI 20 | BITCOIN CASH(BCH) | $431.90 | 8.96% | 7.18% | 56.6 | 19.7 | 9.28 | 134.98 |
|---|
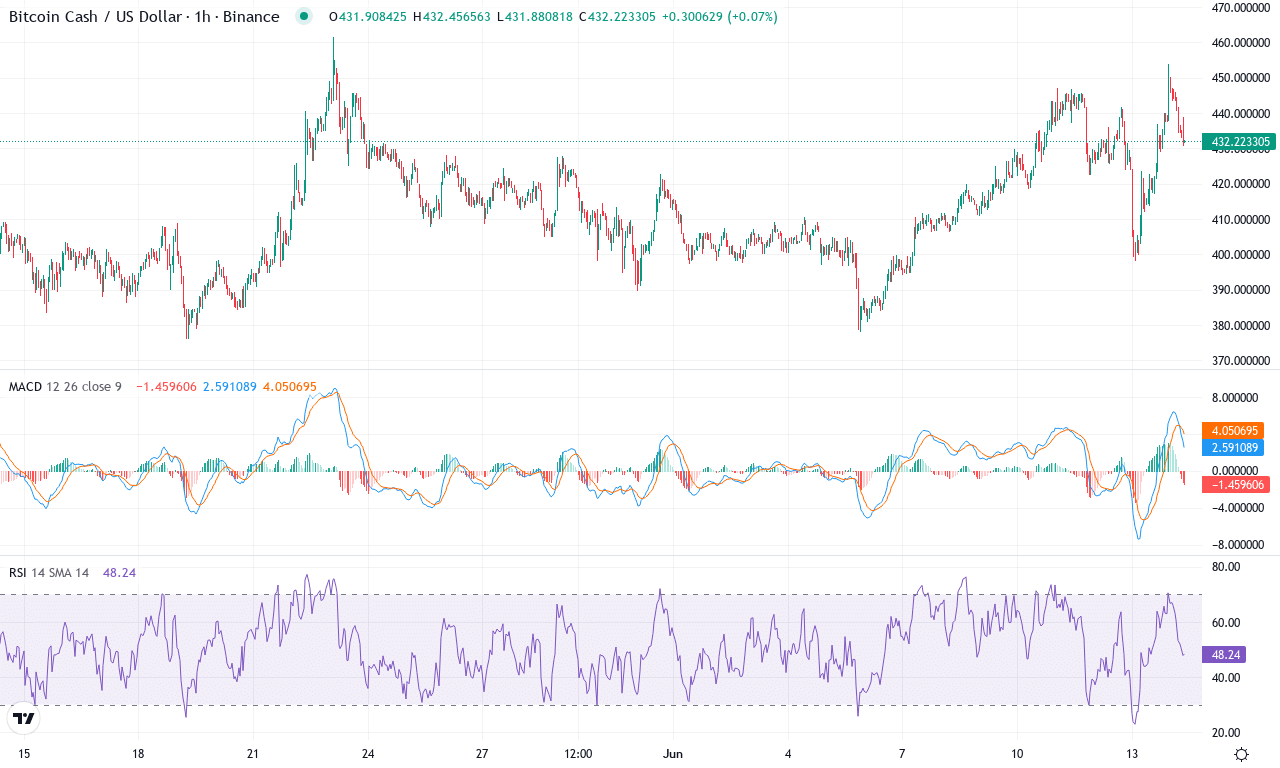
After weeks of erratic swings, Bitcoin Cash is making a bold comeback. The coin notched a stunning 9% weekly surge and sits just below its monthly highs, clocking in at $431.90—well above crucial short-term support levels. Despite last quarter’s double-digit correction, the longer-term chart whispers of resilience, with three-month performance showing a 26% return. The backdrop? A market that’s recently been rattled by volatility, yet Bitcoin Cash is regaining its footing as other alts stall. I can’t help but feel a touch of excitement as momentum finally lines up with structural support—these are the setups traders wait for.
Diving into the technicals, trend indicators are all flashing strong: average trend strength is high, and directional signals hint at bullish momentum swelling. The weekly MACD has flipped positive and is accelerating—classic fuel for further upside. Oscillators echo this optimism, with RSI holding in the 56–58 zone, escaping both overbought and oversold extremes, while momentum readings have jumped sharply after last week’s sideways chop. Critically, price is holding well above all major moving averages, reinforcing underlying demand. The $460–462 region looms as a key resistance zone and a break there would open the path for a run toward $520—where a larger profit-taking surge is likely. Should sellers regain control, initial support is seen near the $410 mark and just below, around $400; anything deeper risks an extended fall toward the $385 area. For now, all signs tilt bullish, but as always in crypto, keep an eye on those pivot levels—markets love to surprise just as many start to believe.
Hyperliquid (HYPE) Price Analysis
| Crypto | Close | 1W% | 1M% | RSI | ADX | MACD | CCI 20 | HYPERLIQUID(HYPE) | $42.29 | 26.88% | 67.75% | 69.8 | 41.7 | 3.44 | 134.96 |
|---|
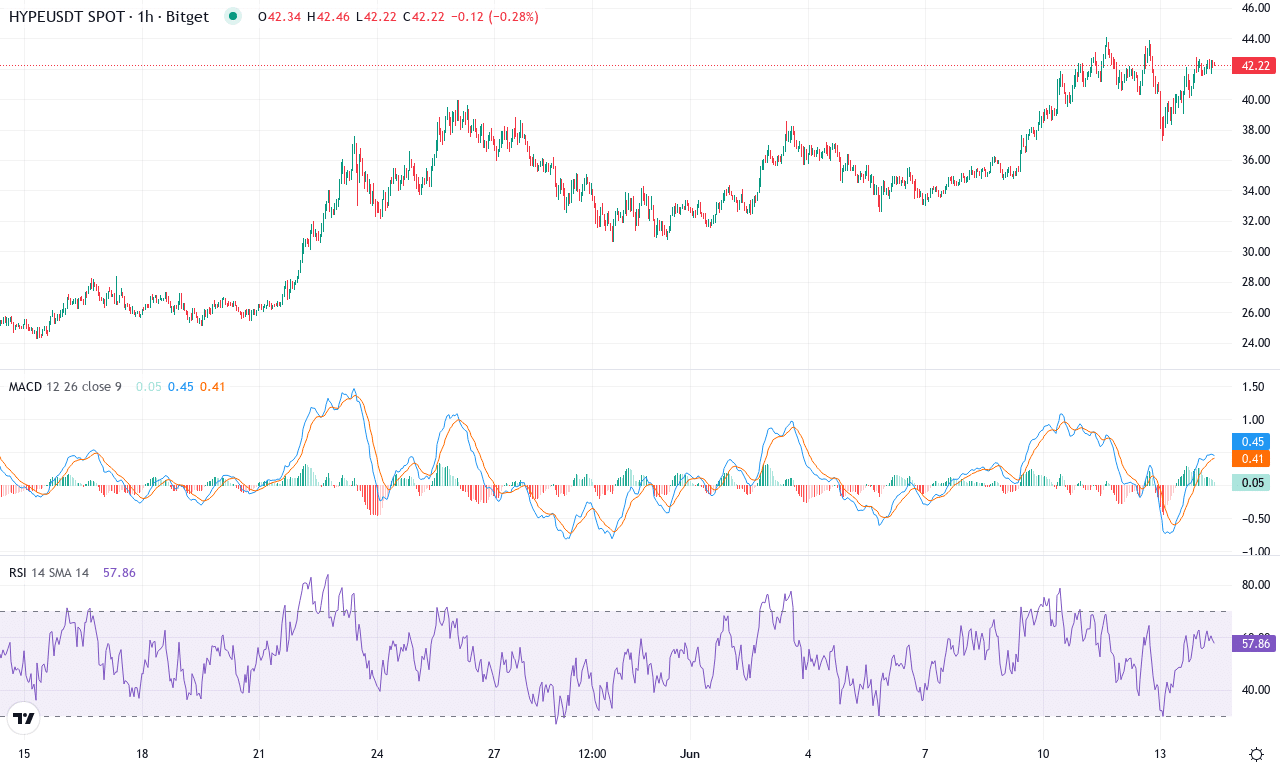
After a massive multi-month rally that saw Hyperliquid surge over 67% in just a month—and a jaw-dropping 1,591% since the start of the year—the token continues to defy gravity, pushing right up against its recent monthly high near $44. With a remarkable 26% jump this past week alone, momentum is clearly favoring the bulls, and the technical picture looks as charged as ever. However, as Hyperliquid trends near the upper edge of its consolidation channel, traders are right to feel a heady mix of excitement and caution; euphoric rallies like this one don’t last forever, and volatility is likely to remain high while the dust settles from the recent run-up.
The trend indicators show plenty of persistence: average directional index readings point to robust trend strength, and positive directional movement is still outpacing the negative. The weekly MACD continues to accelerate above its signal line, offering further confirmation that bullish momentum is swelling. Oscillators, meanwhile, flash vibrant signals—RSI hovers in the mid-70s and recently breached overbought territory, often a red flag for potential profit-taking or even a steep correction. Price action remains well above key moving averages, with the 10-day EMA comfortably underpinning the uptrend and a cushion of support seen near $37. Should buyers clear the psychologically charged $44 resistance, a fresh leg higher could easily test the next round number at $50. However, cracking below initial support risks an extended pullback toward $31, so stay nimble—even the strongest rallies invite both thrills and tough decisions when the tide turns.
Can the Bulls Maintain Momentum?
Bitcoin Cash teeters near its resistance at $431.90, with its next move hinging on sustained buying strength. Meanwhile, Hyperliquid’s volatility remains high as it tests its $44 peak. Should the bulls falter, a pullback to support levels is likely, yet any breakout could mark a new leg up. Traders must watch closely as momentum stalls are possible, but breakthroughs are equally on the horizon.