TAO, OKB, and XDC Compress at Make-or-Break Levels as Volatility Pressure Mounts
TAO, OKB, and XDC are currently coiled at crucial levels, hinting at imminent volatility. After a sharp 18% dip, TAO’s consolidation near $374 has traders on edge, eyeing a potential breakout above $400, signaling either a bullish resurgence or further downside. Meanwhile, OKB’s static movement around $52 raises the classic dilemma: is this quiet before another rally, or foreshadowing a deeper pullback? XDC’s dance around the $0.06 level suggests the market is at a decisive juncture. Let’s take a closer look at the signals behind these moves.
Bittensor (TAO) Price Analysis
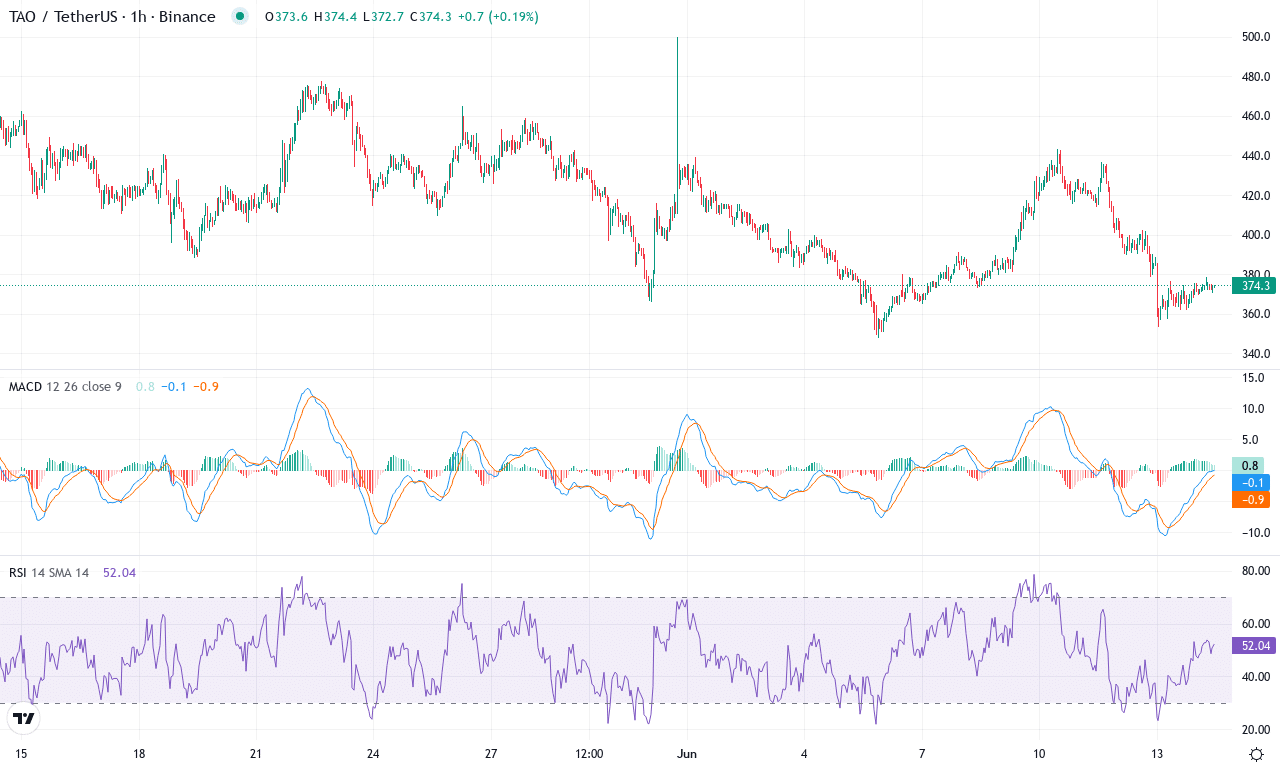
| Crypto | Close | 1W% | 1M% | RSI | ADX | MACD | CCI 20 | BITTENSOR(TAO) | $374.60 | 1.99% | -17.76% | 44.4 | 15.6 | -5.53 | -81.68 |
|---|
After an explosive run in the first quarter, Bittensor (TAO) is now under intense pressure, coming off a sharp monthly drawdown of nearly 18%. Recent price action has seen TAO thrashing between $347 and $500, failing to hold gains and rattling confidence—especially with bulls watching a 6-month slide of nearly 35%. Yet, it’s not all doom: a strong 3-month performance of over 45% hints at bouts of aggressive dip buying beneath the surface. The coin is consolidating just below its monthly midpoint near $423, hovering around $374. Should momentum shift, any decisive move above the $400 region could prove catalytic. For now, sentiment remains divided, but this coil feels ready to spring—one way or another.
Delving into TAO’s technical breadth, the trend indicators tell a tale of diminishing bullish momentum, with oscillators flashing both warning and opportunity. The ADX is impressively elevated, mirroring a still-potent but waning trend, while the weekly MACD continues to slip deeper below its signal—classic signs of bearish momentum overtaking the tape. The RSI treads water near neutral, and multiple oscillators are pointing to possible oversold conditions, hinting that a relief bounce could materialize if sellers exhaust themselves. Price is currently sandwiched below key exponential moving averages, which suggests that resistance in the $400–$423 band remains formidable. If bulls pierce that cap, a swift move toward $507—the next resistance and a psychological round number—is on the cards. On the flip side, failure to hold above $347 would turn the outlook brittle, opening the door to a steep correction. I’ll admit, I’m watching this pivot with bated breath: TAO trades like a coiled spring, and the coming breakout—up or down—could be dramatic.
OKB (OKB) Price Analysis
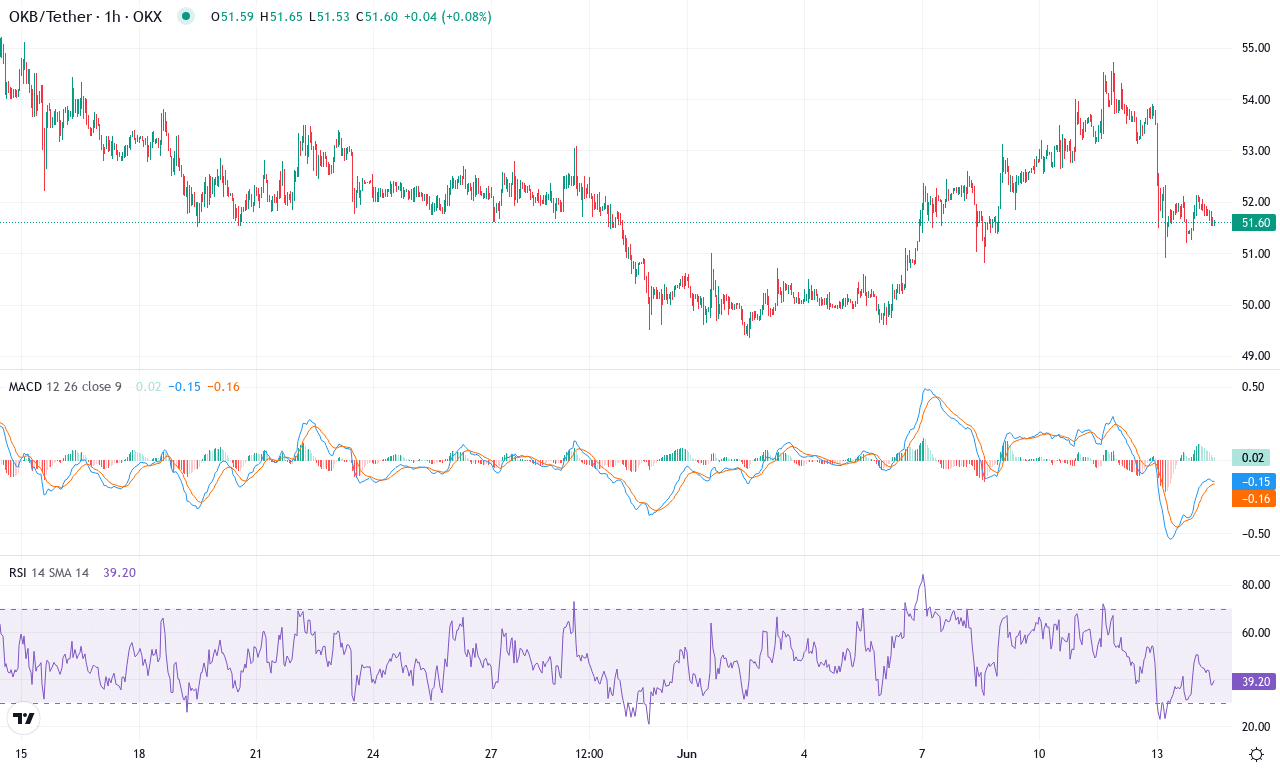
| Crypto | Close | 1W% | 1M% | RSI | ADX | MACD | CCI 20 | OKB(OKB) | $51.69 | -0.10% | -5.16% | 47.5 | 13.3 | 0.14 | 9.20 |
|---|
After a strong run ahead of the broader crypto market earlier this quarter, OKB appears to be taking a breather. The last week saw it barely move—essentially flat—but for the month, holders have had to weather a modest 5% drawdown. This recent pullback interrupts an otherwise impressive three-month advance, where OKB outperformed much of the sector with an 11% climb. However, given its proximity to the monthly low and continued choppy action around the $52 mark, OKB seems to be oscillating between profit-taking and cautious accumulation. The big question for traders now: is this just consolidation before another push, or the early stages of a steeper correction? Personally, I’m keeping a close watch—when a coin like this compresses near key moving averages, something big is usually brewing.
Technically, OKB’s trend indicators are starting to flash warning signs. Trend strength is waning—the directional index has flipped, showing bears edging out bulls—and the weekly MACD, while still positive, has lost some momentum versus last week’s readings. Oscillators hint at indecision: RSI remains comfortably above 50 (not in overbought territory, but far from oversold), while momentum and the Commodity Channel Index are flattening out. Price action analysis shows OKB stuck below the 10- and 20-period exponential moving averages, with immediate resistance stacked at $54.70 and firmer support resting around the $49.30 zone. If sellers force a breakdown below $49, risks extend for a retest towards $47 or lower—but if bulls regain control above $54.70, the path could clear for a run at the previous highs. As always: never assume stasis lasts—compression at these levels often precedes volatility surges, and missing the first move can sting!
XDC Networks (XDC) Price Analysis
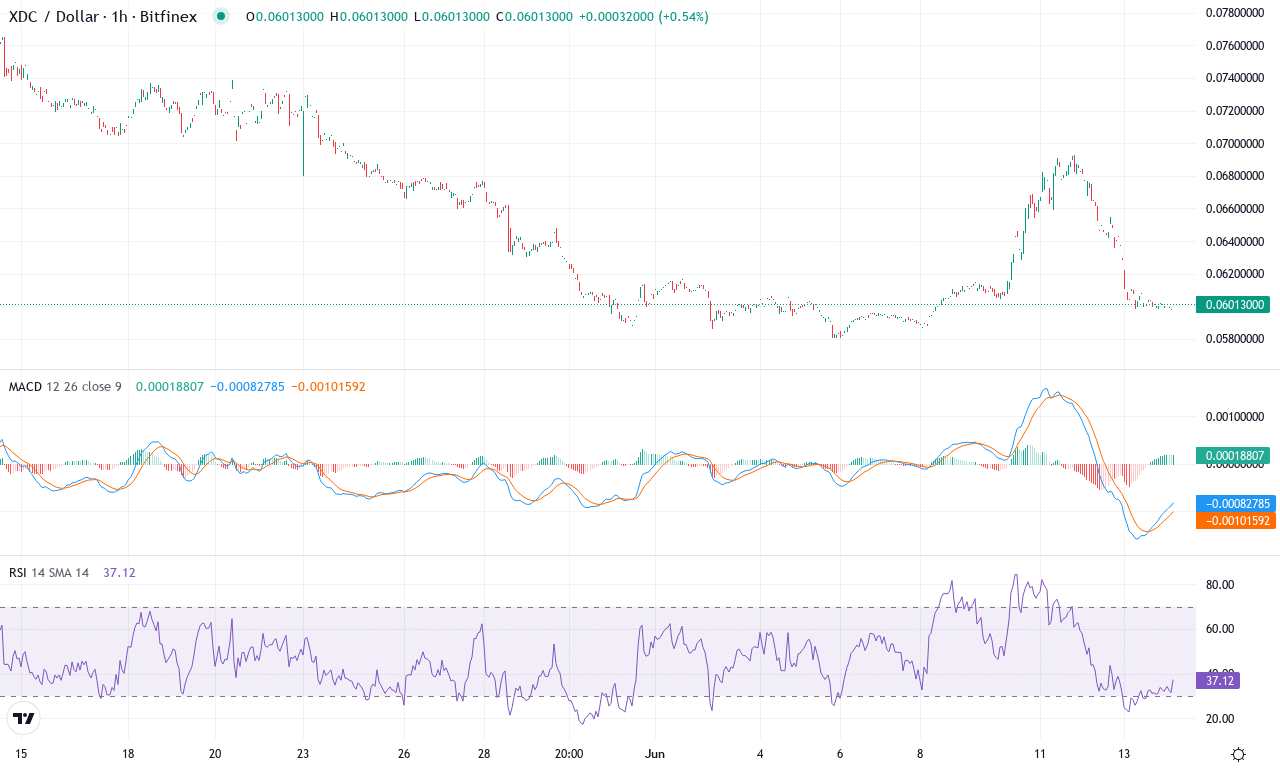
| Crypto | Close | 1W% | 1M% | RSI | ADX | MACD | CCI 20 | XDC NETWORKS(XDC) | $0.06 | 0.59% | -19.94% | 40.2 | 27.6 | 0.00 | -52.94 |
|---|
After a punishing month that saw XDC Networks tumble nearly 20%—making it one of the more battered altcoins in the sector—there’s a sense that something has to give. XDC is currently clinging to the psychological $0.06 level after another week of flat price action, with year-to-date losses mounting and the six-month trend solidly negative. Still, with price consolidating just above a multi-month low, the technical outlook suggests the market is at a crossroads. I can almost feel the tension on the chart—will XDC finally capitulate below $0.058, or are the bears running out of steam? With so much ground lost, the risk of an extended fall is real, but the rubber band feels stretched. Seasoned traders know: deep dives like these often precede either capitulation or a dramatic reversal.
Digging into the technicals, trend indicators are still flashing warning signs, with negative pressure dominating and oscillators showing limp momentum—no sign yet of a proper bounce. The average directional index reveals a strong trend in favor of sellers, and the MACD remains in narrowly negative territory, signaling sluggish downside drift but no sudden collapse. RSI sits in middling territory, not yet oversold, and the price languishes beneath its fast and slow moving averages, underscoring bearish control. XDC is sandwiched between firm resistance near $0.073 and major support just below $0.058—a break in either direction should spark a volatility surge. If bears break through the floor, I’d watch for a steep correction toward $0.053. But if buyers defend this zone and trigger a short squeeze, upside momentum could target the $0.066–$0.073 range. Right now, price action analysis says “hands off,” but if XDC claws back over $0.066 with conviction, it may finally be time to dip a toe back in.
Navigating Market Tensions
TAO’s steady position near $374 keeps the spotlight on a $400 breach to dictate its next move. Similarly, OKB holding at $52 highlights a critical zone where a price surge or retreat could soon take shape. Observers of XDC are preparing for a significant shift, as its current level suggests an impending decision point. Traders should brace for tight setups that might lead to unfolding opportunities or caution in choppy waters.