HYPE Defies Gravity as PI, PEPE, TAO, and SONIC Teeter on Key Support Axes
In a market where even stalwarts face turbulent seas, HYPE has remarkably soared, achieving a dazzling 55% rise over the last month and settling just shy of $44. As it touches critical resistance levels, the altcoin defies sector-wide consolidations, posing a bold question as traders weigh further gains against profit-taking opportunities. Are we witnessing the dawn of a fresh rally, or is a cooldown inevitable as traders ponder these gains? Let’s take a closer look at the signals behind the move.
Hyperliquid (HYPE) Price Analysis
| Crypto | Close | 1W% | 1M% | RSI | ADX | MACD | CCI 20 | HYPERLIQUID(HYPE) | $40.68 | 16.53% | 55.50% | 63.8 | 40.8 | 3.20 | 92.03 |
|---|
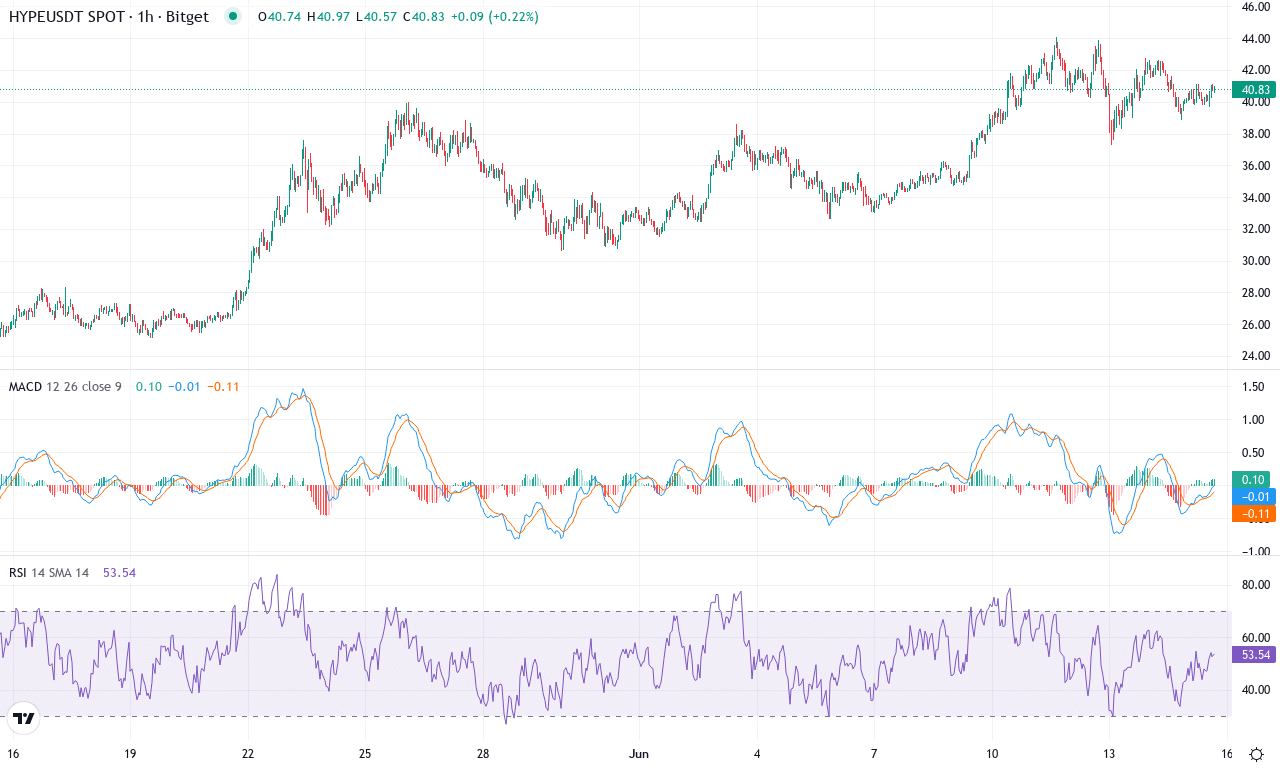
After an explosive 55% surge over the past month, Hyperliquid (HYPE) is undeniably capturing trader attention, sailing to fresh monthly highs at $44 and cementing a staggering 1,527% gain year-over-year. This month’s bullish momentum stands out against a backdrop of widespread sector volatility—HYPE’s resilience and momentum defy gravity, especially as most altcoins remain locked in wide-ranging consolidations. The short-term rally has succeeded in lifting the price well above key moving averages and pressing up against new resistance near the psychological $40 mark, igniting debate as to whether this run has more room or is ripe for a bout of profit taking. I have to admit, watching HYPE shred overhead supply at this velocity is a rush—momentum chasers are likely feeling vindicated, but a breather wouldn’t be a shock here.
Digging into the technicals, trend indicators point strongly higher—an aggressive, rising ADX confirms robust trend strength while a clear positive divergence in moving averages underlines bullish direction. On the oscillator front, the weekly MACD reveals sharp acceleration, with its histogram expanding and the signal line confirming sustained upside drive. RSI remains elevated, signaling overbought territory—when RSI consistently hovers above 70, extension risk grows, but any bearish reversal has yet to materialize. Price sits comfortably above all key EMAs, reinforcing a bullish technical outlook, while current positioning near the $41–$44 zone acts as both a resistance cluster and a magnet for liquidity probing. If HYPE can slice through $44 with conviction, the next natural price target looms near $50, bolstered by momentum and a potential squeeze of sidelined shorts; failure here, however, may trigger a profit-booking surge with a corrective pullback toward support at $36. If you’ve been riding this wave, congratulations—just remember, parabolic runs rarely last forever, and vigilance is key as volatility swells.
Pi Network (PI) Price Analysis
| Crypto | Close | 1W% | 1M% | RSI | ADX | MACD | CCI 20 | PI NETWORK(PI) | $0.60 | -5.74% | -32.38% | 39.3 | 18.3 | -0.04 | -82.12 |
|---|
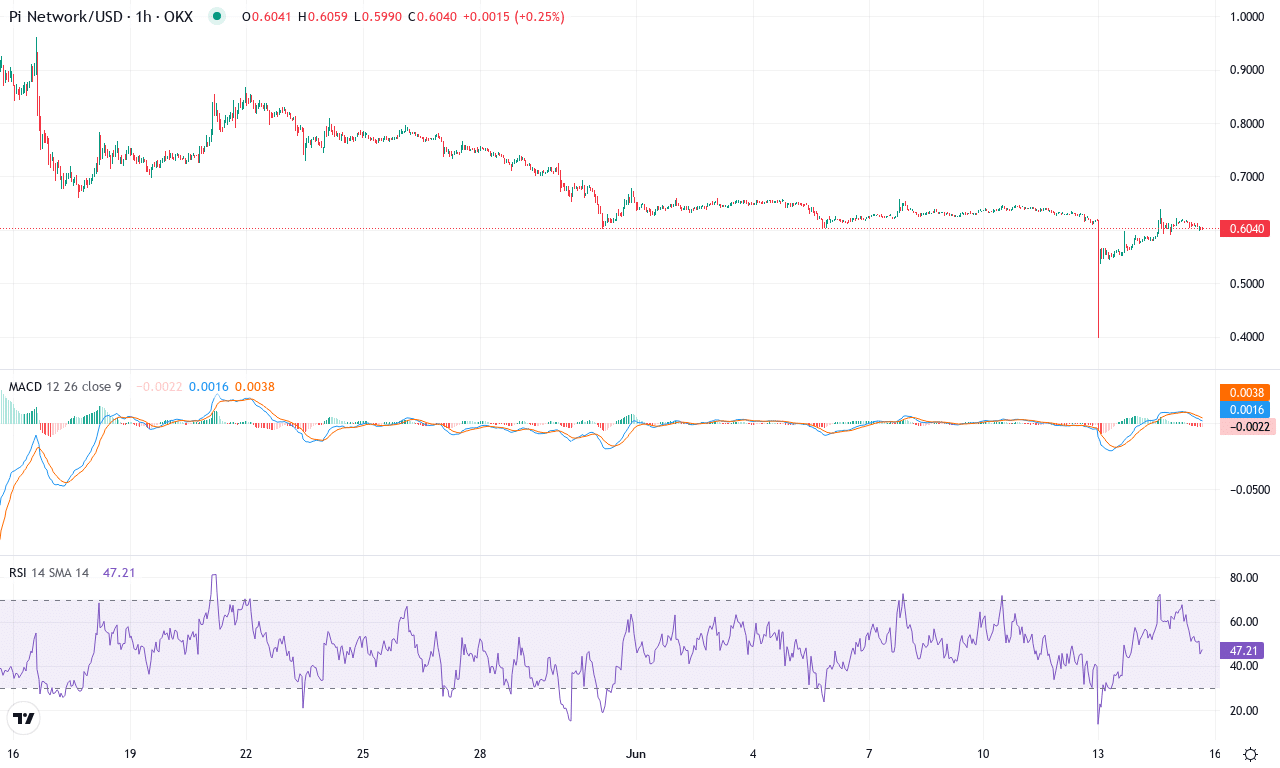
After months of steep declines and failed bounce attempts, Pi Network (PI) remains in the doldrums, weighed down by relentless selling and a brutal 32% monthly drop. The token’s price continues to bleed, slipping toward recent monthly lows as buyers struggle to regain control. Performance across all major timeframes is distressing—PI is down over 57% for the quarter and remains deep in negative territory for the year. The technical outlook suggests that bearish momentum is firmly entrenched, with bears keeping sellers in the driver’s seat. Until we see a decisive shift, PI’s narrative is a cautionary tale: failed rallies, no clear reversal, and an open question as to where the next real support lies.
Turning to the technical landscape, trend indicators flash warning signs—PI’s ADX holds at high levels, confirming a strong ongoing trend, but the negative DI far outpaces the positive, underscoring prevailing bearish momentum. The weekly MACD still points lower, while oscillators, including a depressed RSI hovering around 39, reinforce oversold conditions—yet, the market offers no comfort, as each faint rebound meets stiff resistance. The price sits below nearly all key moving averages, signaling sustained downward pressure, with the closest resistance clustering near $0.73 and $0.96. Meanwhile, support looks increasingly fragile around $0.60 and stretch lows at $0.40. If bulls can stage a surprise push above $0.73, upside could extend toward $0.96, but risks of an extended fall remain acute if the $0.60 floor gives way. Personally, PI’s recent price action makes me anxious—remember, you’re only at a loss if you sell, but right now, sellers rule the tape.
Pepe (PEPE) Price Analysis
| Crypto | Close | 1W% | 1M% | RSI | ADX | MACD | CCI 20 | PEPE(PEPE) | $0.00 | -3.19% | -14.20% | 44.1 | 20.7 | 0.00 | -84.16 |
|---|
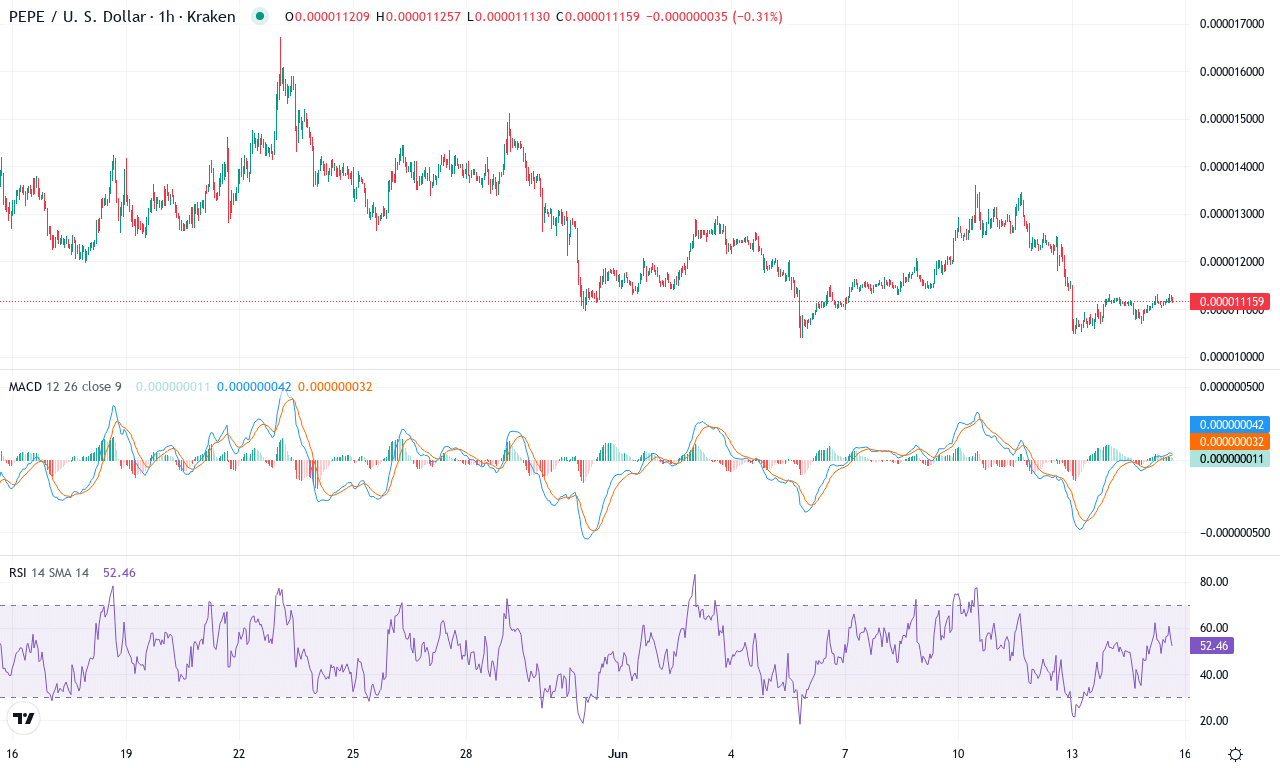
After a whirlwind three-month rally that saw PEPE rocket nearly 70%, this meme coin is now deep into a steep correction, falling more than 14% over the past month. Traders accustomed to PEPE’s relentless momentum are seeing volatility cut both ways—upside euphoria has clearly given way to heavy profit-taking and a dose of old-fashioned fear. The coin is parked just above $0.00001110, close to monthly lows and well off the speculative highs above $0.000016. The technical outlook suggests rising risk as the sharp reversal challenges the previously bullish narrative, and while the longer-term uptrend remains (barely) intact, downside pressure is starting to mount in earnest. I’ll be honest: PEPE’s manic swings are not for the faint of heart, and right now, the bears have the upper hand.
The trend indicators echo the cautionary mood. A robust ADX reading signals a strengthening trend, but the growing dominance of sellers is clear as negative directional movement gains traction, outstripping the bulls. The weekly MACD is flattening and the oscillators are showing a clear loss of upward momentum; the relative strength index has rolled over, plunging toward oversold territory—always a warning bell for extended corrections. PEPE trades below all short-term moving averages, and price is now pinned beneath the next key resistance zone around $0.000012—if buyers can force a close above this level, the door to $0.000014 reopens, and a surge could catch even seasoned traders off guard. However, failure here could trigger a further slide toward support at $0.0000104; a decisive break below that, and risks extend toward the psychological $0.00001 round number. As momentum stalls and volatility picks up, scenario planning is critical—don’t get caught without a stop, and remember: you’re not in the red until you sell.
Bittensor (TAO) Price Analysis
| Crypto | Close | 1W% | 1M% | RSI | ADX | MACD | CCI 20 | BITTENSOR(TAO) | $373.80 | -3.14% | -14.38% | 44.9 | 15.1 | -7.32 | -83.32 |
|---|
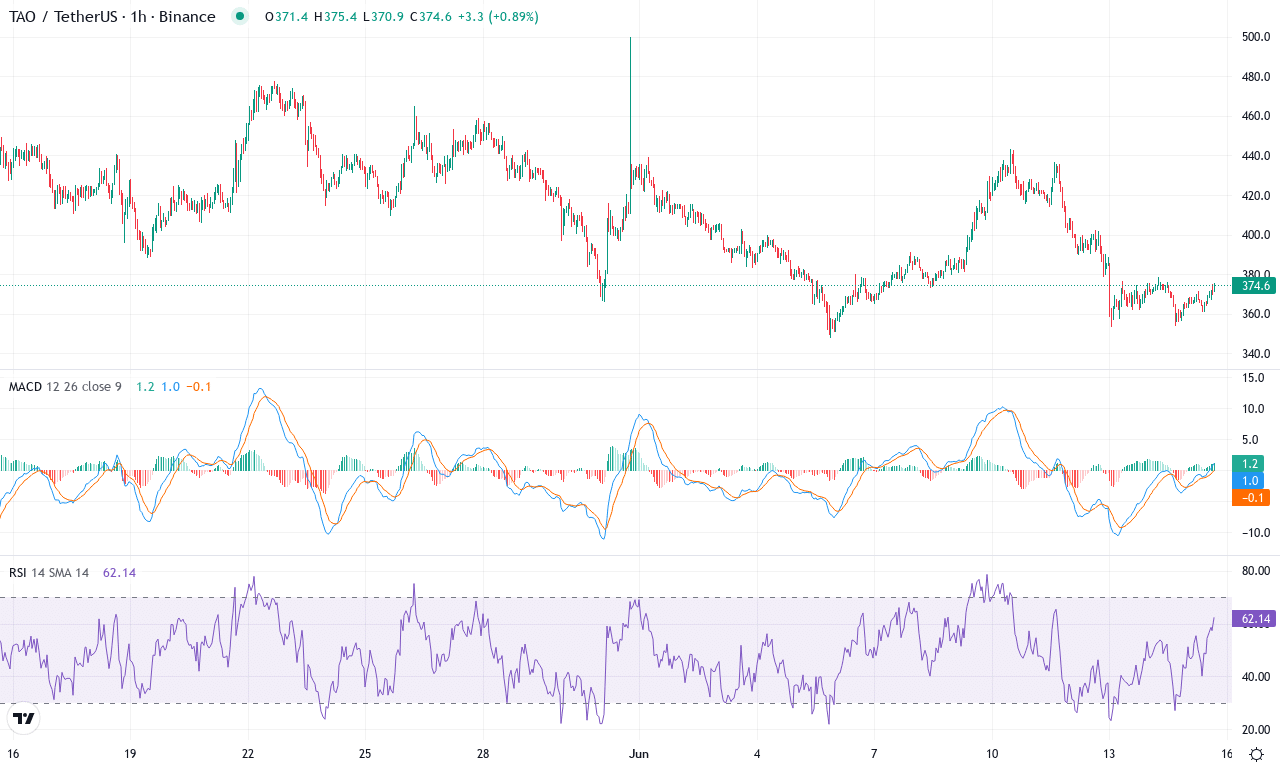
After a blistering 3-month surge of over 55%, Bittensor (TAO) is experiencing notable turbulence, as this past week saw sellers assert control with a sharp -3% drop—capping off a rough month down nearly 14%. Despite spectacular gains earlier this quarter, the tables have turned: TAO now finds itself caught between bullish ambitions and cautious profit-taking. Momentum has shifted as price hovers near its monthly low of $347.40, and with current trading at $373.80, Bittensor sits precisely at a crossroads between flagged support and resistance. Given TAO’s wild volatility in recent months, it’s hard not to feel both anticipation and a tinge of caution—any sign of renewed institutional demand could quickly rekindle the uptrend, yet the technical outlook suggests bears are not done yet.
Diving into the technicals, trend indicators are flashing warnings: directional movement paints a lopsided picture, with sellers holding the upper hand and trend strength still elevated. The weekly MACD shows persistent bearish momentum, while oscillators like the RSI and CCI have slumped out of overbought territory—sometimes an early hint for a deepening correction. TAO’s price action remains beneath the nearest short-term moving averages, suggesting recovery attempts may stall around the $395–$400 zone. If bulls manage to reclaim $400, look for a fresh run to challenge resistance at $423 and possibly the psychological barrier at $500—a level I’d love to see tested after this cooldown. On the flip side, weakness below $347 signals risks of an extended fall toward the next support near $262. As volatility lingers and traders eye key pivots, buckle up—TAO’s next act could be just as dramatic as its last rally.
Pi Network (PI) Price Analysis
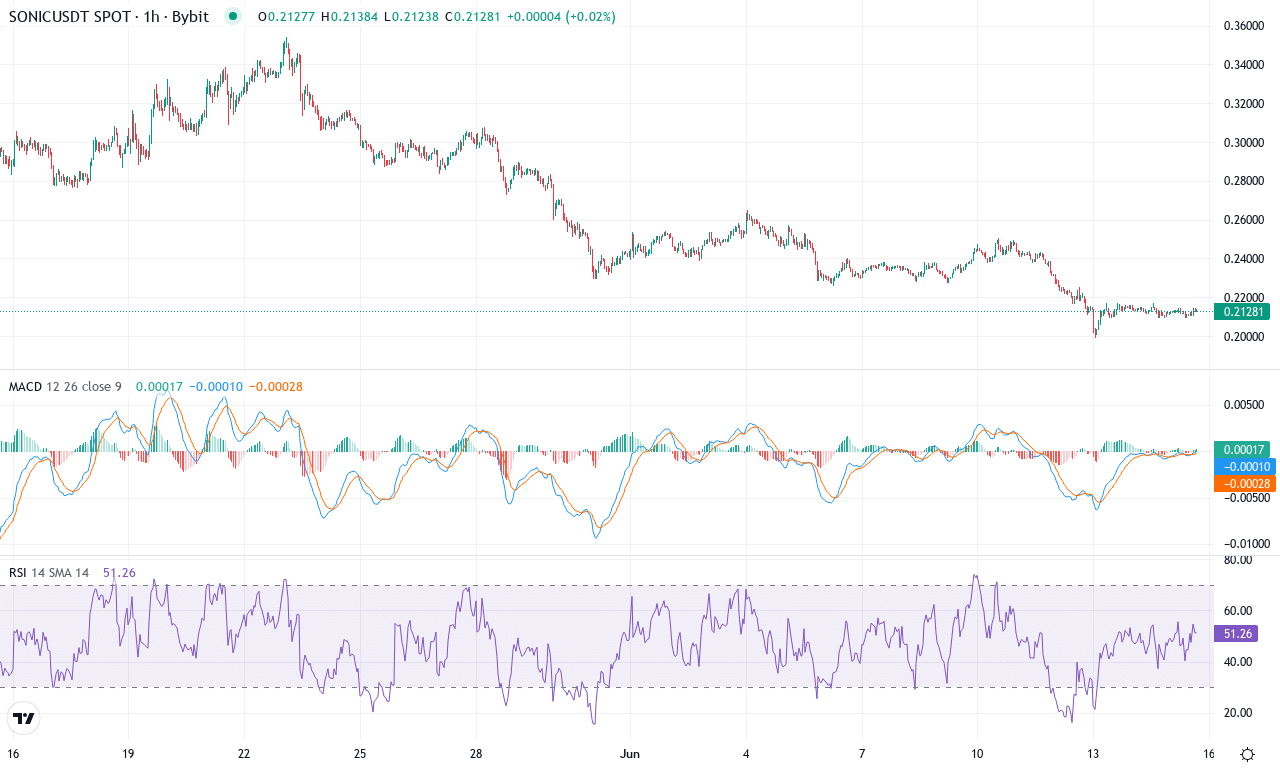
| Crypto | Close | 1W% | 1M% | RSI | ADX | MACD | CCI 20 | SONIC(S) | $0.21 | -9.74% | -26.33% | 33.9 | 27.1 | -0.02 | -121.40 |
|---|
After an explosive rally that catapulted Sonic to a jaw-dropping 964% six-month gain, the euphoria has sharply reversed course. Over the past week, Sonic has plunged nearly 10%, extending its monthly slide to more than 26% and plunging back toward its monthly lows. This dramatic reversal hints at severe profit-taking and a broader risk-off mood, erasing much of the froth from earlier momentum. While the long-term trend remains positive thanks to Sonic’s epic run, the latest price action suggests that bullish momentum is stalling right at the edge of an important support zone near $0.20. As traders digest these rapid shifts, one can feel the tension building: will Sonic find its footing, or are sellers preparing for another leg down?
The technical outlook paints a picture of teetering conviction. Trend indicators still show moderate strength, but negative momentum has reasserted itself—MACD is slipping further beneath its signal line, and oscillators like the Awesome Oscillator and CCI are pushing deeper into bearish territory. RSI is stuck firmly in the neutral zone, nowhere near overbought, suggesting Sonic isn’t due for a snapback just yet. The price is now teetering just above its key exponential moving averages and closing in on the monthly pivot’s middle zone, intensifying the suspense at current levels. If bulls manage to defend the crucial support near $0.20, we could see a technical bounce back toward resistance at $0.27. However, a decisive move below $0.20 risks an extended fall, opening the door to a steeper correction that could push Sonic closer to its monthly lows around $0.19. As always, these are the moments when conviction is tested—if you’re still in this trade, buckle up for a potentially wild ride.
Is HYPE’s Ascent Sustainable?
As HYPE tests its resistance near $44, its ability to maintain this trajectory could offer traders more bullish prospects, while PI, PEPE, TAO, and SONIC linger at precarious support levels. Continued strength in HYPE might signal a broader rally, yet vigilance is needed as profit-taking could trigger reversals. Observing market reactions in the coming days will be key to understanding whether this momentum has deeper roots or if the rally’s wings will tire.
