Bitcoin, Ethereum, and Maker Bulls Eye Breakout as Resistance Zones Tighten and Volatility Brews
As Bitcoin, Ethereum, and Maker rack up impressive gains, enthusiasm is tempered by the proximity of looming resistance zones, ready to test the mettle of bullish traders. Maker’s recent 25% jump to just below $2,260 is a case in point, with traders wondering if it has the momentum to breach new highs. With volatility humming beneath the surface, the market stands at a technical crossroads. Will this bullish fervor overcome the hurdles, or is a short-term exhaustion setting in? Let’s take a closer look at the signals behind the move.
Maker (MKR) Price Analysis
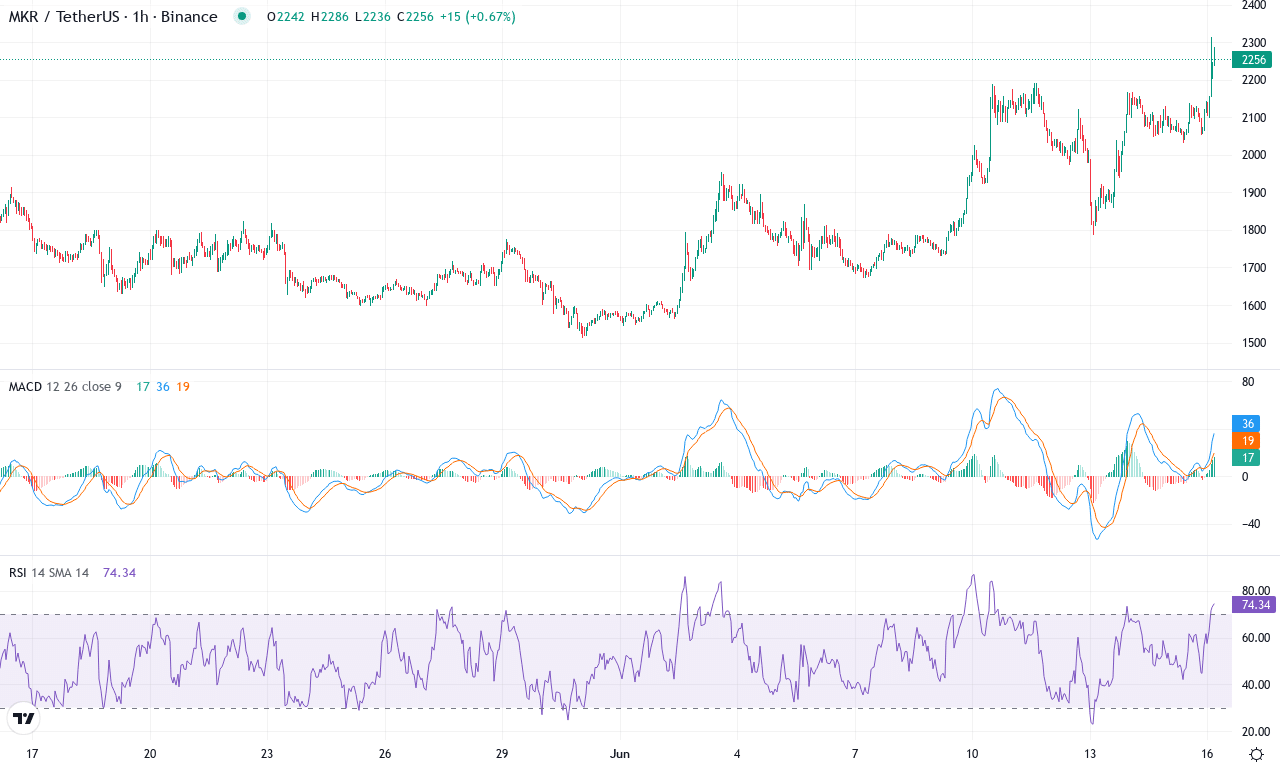
| Crypto | Close | 1W% | 1M% | RSI | ADX | MACD | CCI 20 | MAKER(MKR) | $2255.00 | 27.98% | 25.00% | 67.6 | 25.2 | 131.54 | 142.40 |
|---|
After a sizzling 25% surge this month, Maker (MKR) has rapidly shifted gears from hesitant consolidation into full-blown breakout momentum. Bulls have powered the price from monthly lows near $1,511 to highs topping $2,314, with MKR currently resting just under $2,260. The recent rally caps off an 87% gain over the last three months—a dramatic reversal from a lackluster yearly performance. What captures my attention is MKR’s ability to hold above all major moving averages, and in this environment, volatility isn’t just back, it’s making a scene. This kind of powerful upside after extended chop is what every trend trader dreams of, and the technical outlook suggests there’s still fuel in the tank.
Digging into the technical structure, all major trend indicators are screaming strength: the weekly MACD continues its steep acceleration, and the directional index signals show bullish momentum easily overwhelming any bearish attempts. Oscillators support the case—RSI and its peers remain buoyant but haven’t breached extreme overbought territory, suggesting there’s no immediate exhaustion. Price is comfortably north of the 10-, 20-, and 30-period exponential moving averages, confirming the uptrend is well-established. All eyes are now fixed on resistance near $2,315—a decisive breakout above this level would likely send MKR toward the next psychological target at $2,750, especially if volume swells. On the flip side, should profit-taking trigger a reversal, watch for support around the $2,050 to $1,900 zone, where multiple moving averages and previous breakout points converge. For now, bullish conviction is riding high—but I’m watching for any sign of reversal risk. Remember, staying nimble is key when the tide turns this quickly.
Ethereum (ETH) Price Analysis
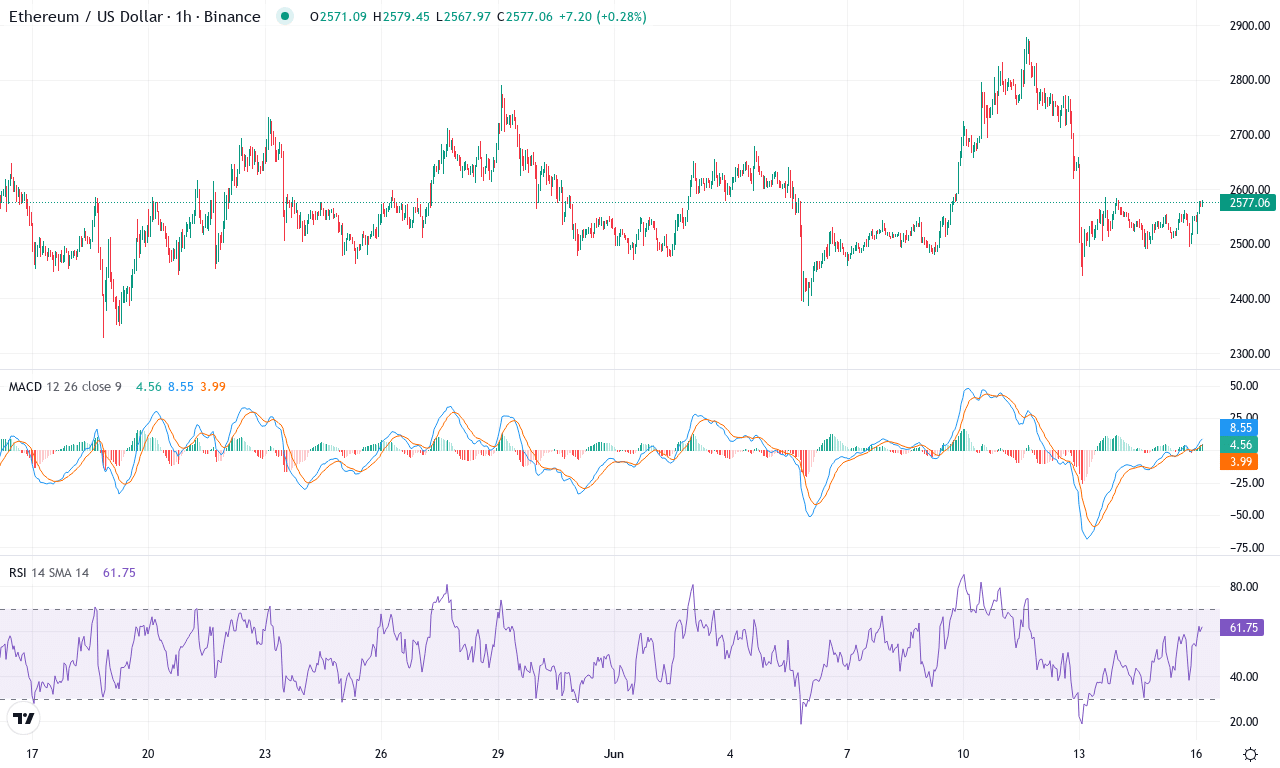
| Crypto | Close | 1W% | 1M% | RSI | ADX | MACD | CCI 20 | ETHEREUM(ETH) | $2576.44 | 2.59% | 1.56% | 52.0 | 18.7 | 44.71 | -27.94 |
|---|
After a stretch of choppy action, Ethereum is turning heads with renewed resilience, climbing back toward $2,600 after dipping near $2,326 this month. Despite last month’s modest gain, the big narrative is the wild 34% rally seen over three months—followed, however, by a brutal six-month drawdown. Even so, the current price is holding firm right above major moving averages, and this week’s small uptick hints that bullish momentum isn’t fully spent just yet. Volatility has clearly picked up, making the immediate boundary at $2,800 the psychological and technical frontier for bulls. With institutional sentiment still shaky after recent long liquidations, everyone’s watching to see if ETH can shake off its sideways range and press higher—if that happens, I wouldn’t want to be caught short.
The technical outlook suggests ETH’s trend is at a crossroads. The weekly MACD shows an ongoing struggle—momentum isn’t inspiring, but there’s no fresh sell signal, either. Trend indicators, including the ADX, are yet to confirm a dominant direction, underscoring a market waiting for a clear catalyst. Oscillators are in neutral to slightly positive territory; RSI is hovering near mid-line, neither screaming overbought nor oversold, and momentum readings look indecisive. Importantly, price remains compressed between the short-term exponential and volume-weighted averages, emphasizing this battleground zone. If buyers succeed in blasting through $2,800 resistance, the next upside target sits near $3,400, in line with major pivot levels. Conversely, a drop below $2,350 support risks a steep correction—watch that level like a hawk. Personally, I’m on alert: the next big move could snap fast, and with ETH, fortunes can pivot in a heartbeat.
Bitcoin (BTC) Price Analysis
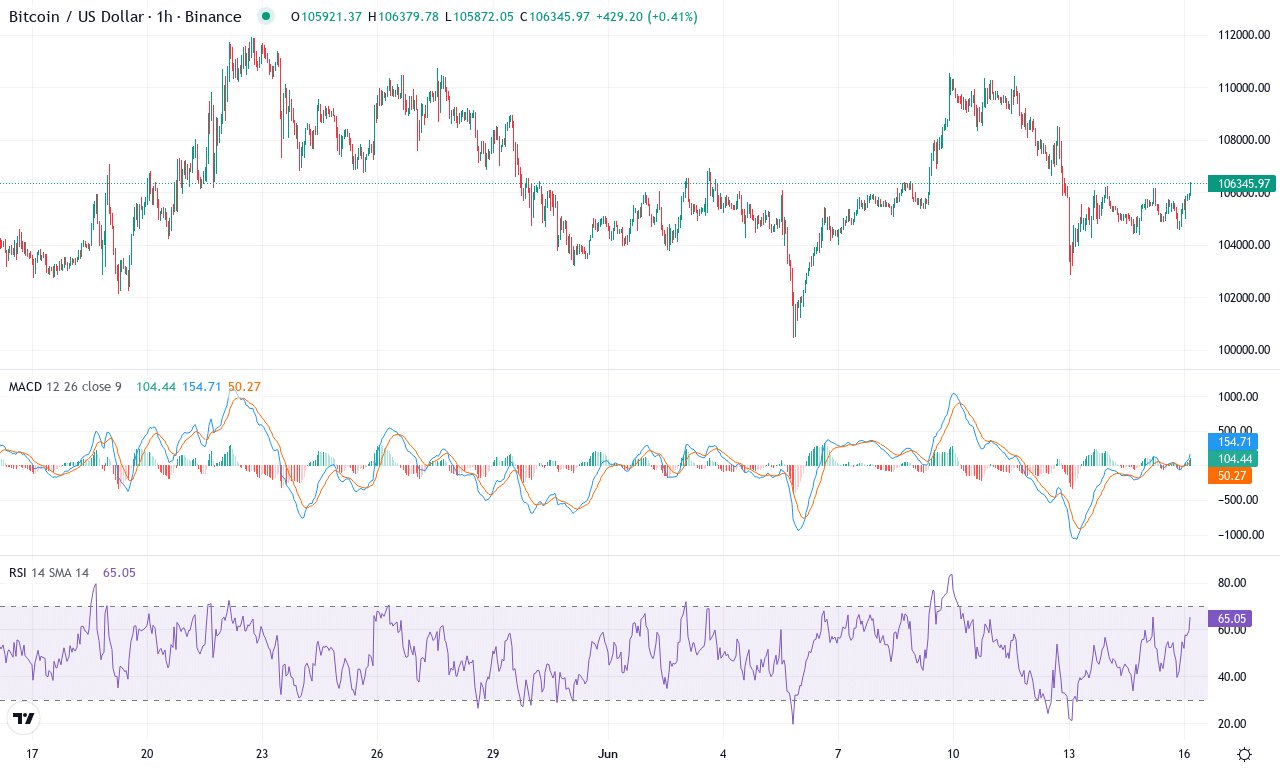
| Crypto | Close | 1W% | 1M% | RSI | ADX | MACD | CCI 20 | BITCOIN(BTC) | $106273.93 | 0.47% | 2.64% | 52.2 | 18.2 | 692.59 | -1.81 |
|---|
After a month marked by choppy consolidation, Bitcoin is asserting itself atop the crypto leaderboards once again, pushing past $106,000 and notching a solid 2.6% monthly gain. Short-term action has been muted, with just a fractional pop over the past week, but that calm feels like the deep breath before a move. On higher timeframes, Bitcoin’s 26% surge over the past three months dominates the narrative—momentum is undeniably bullish, and the yearlong uptrend remains alive despite brief macro jitters. Technically speaking, the coin sits well above its cluster of moving averages, with price action comfortably poking above the $106,000 zone—a key psychological and technical level. While barricades loom at $110,000 and $113,300, the underlying strength gives buyers reason to believe a larger breakout may be on the cards. As always, though, I’m keeping one eye on the exit; volatility has a habit of rearing its head just when consensus gets comfortable.
Diving into the technical landscape, Bitcoin’s trend strength remains robust, with oscillators flashing green and trend indicators preserving a steady upward bias. The ADX signals a resolute underlying trend, while the weekly MACD continues to accelerate higher—a textbook sign of bullish momentum swelling beneath the surface. Momentum is positive but not overheated—the RSI is hovering confidently above 60, steering clear of classic overbought territory. The price is riding above short- and long-term exponential moving averages, confirming broad institutional demand and keeping profit-taking at bay. Immediate resistance looms large near $111,900, and a decisive push beyond this barrier could trigger the next leg toward $121,800 and possibly even $140,000 if the market catches fire. On the flip side, a failure to cement gains above $106,000 could invite a swift pullback toward support at $102,900 or, in a steeper correction, the $94,800 region. For now, all signs point to breakout momentum; but as always in crypto, I never rule out a plot twist. Stay nimble—Bitcoin’s next act might be its boldest yet.
Will Bulls Conquer Resistance?
Bitcoin is flirting with its resistance, while Ethereum approaches a critical level that could spur more gains. Maker’s sharp rise highlights the nearness of its ceiling, posing questions on its staying power. As these coins test their boundaries, the coming trading sessions will determine if their momentum can sustain a breakout or signal a potential stall.