Bitcoin Bulls Eye $112K While BNB and LEO Coil Below Breakout Zones
Bitcoin and Ethereum have both posted impressive monthly gains, but key resistance zones now stand in the way. As Bitcoin approaches the critical psychological level of $112,000 after a 3.4% monthly surge, both bulls and bears find themselves at a decisive juncture. Will this momentum propel Bitcoin past the bar, or will the energy wane, inviting a short-term retracement? Let’s break down what the key indicators are suggesting now.
Bitcoin (BTC) Price Analysis
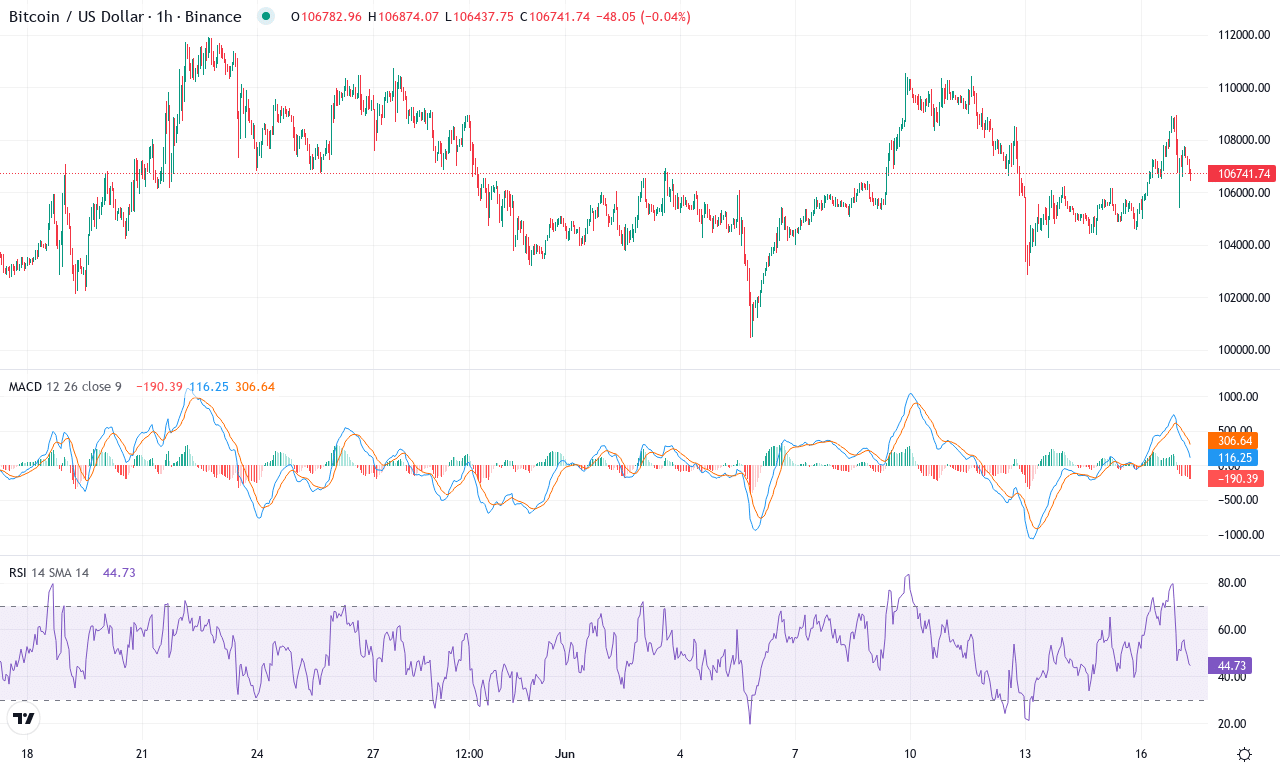
| Crypto | Close | 1W% | 1M% | RSI | ADX | MACD | CCI 20 | BITCOIN(BTC) | $106684.32 | -3.22% | 3.34% | 53.2 | 15.8 | 696.59 | 36.59 |
|---|
After a month of wide swings and renewed volatility, Bitcoin has regained the market’s spotlight, posting a strong monthly performance with a near 3.4% surge and trading comfortably above $106,000. While last week’s marginal dip hints at profit-taking and some nerves among late entrants, the broader trend still leans bullish—especially when viewed against Bitcoin’s staggering 60% yearly gain. With the price clinging just under its recent highs, the technical outlook suggests the bulls are consolidating energy for another leg up. If Bitcoin finally conquers resistance around $112,000, we could see the next stage of breakout momentum unfold; personally, a close above that psychological barrier would be a thrill—fortunes are built at breakouts, not at tops.
Diving into the technical gauges, trend indicators reflect robust underlying strength—Bitcoin’s ADX is firmly elevated alongside positive directional flows, signaling that the uptrend has real backbone. The weekly MACD is pushing higher and shows increasing separation from its signal line, while oscillators like the RSI park just below classic overbought territory. That tells me traders are eager but not exhausted, and fresh capital could still chase the rally. The current price dances close to ten- and twenty-day exponential moving averages, further confirming the near-term bullish posture. Critical support sits in the $98,000–$100,000 zone—if sellers ever seize control, a quick dip toward that area would likely invite aggressive buying. However, if bulls punch through $112,000, the charts point to $121,000 as the next big resistance magnet. Remember: market nerves feel tense at major pivots, but all signs point higher unless Bitcoin decisively loses $98,000—at which point, risks of a steep correction would leap. For now, the trend is the trader’s friend.
BNB (BNB) Price Analysis
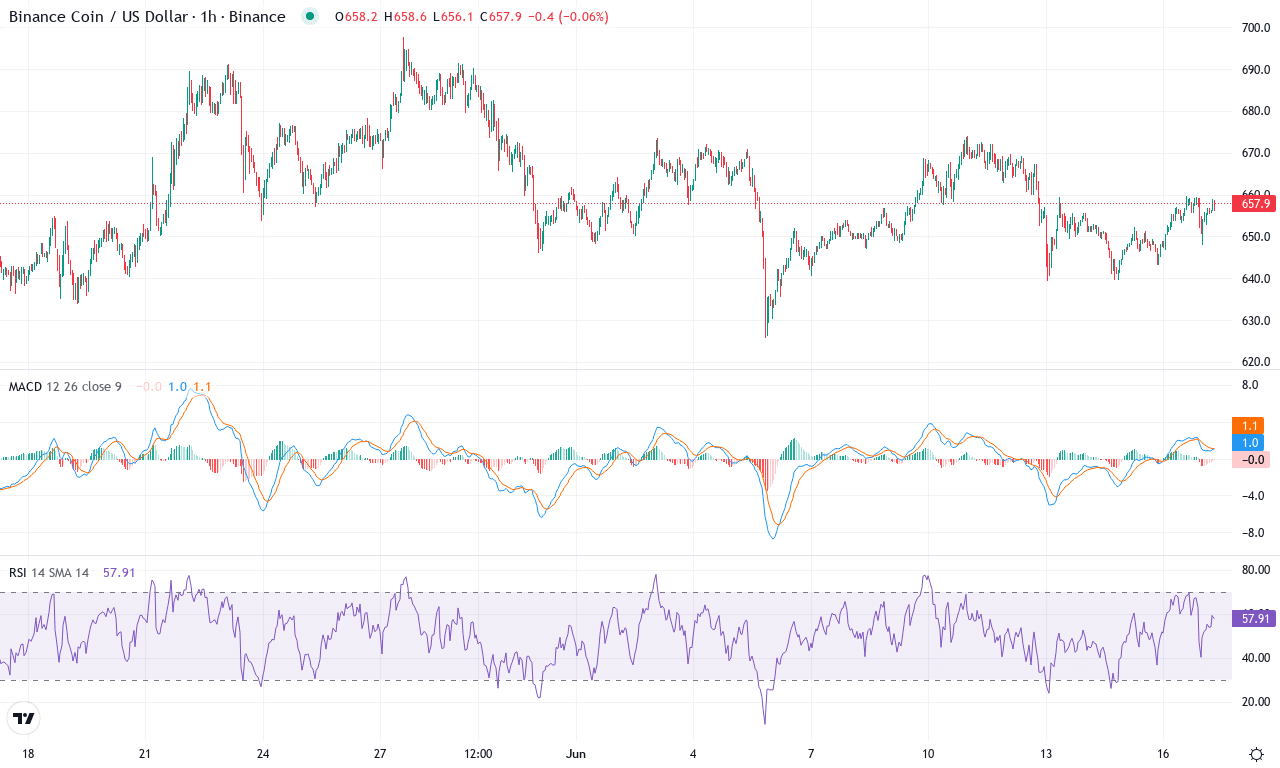
| Crypto | Close | 1W% | 1M% | RSI | ADX | MACD | CCI 20 | BNB(BNB) | $657.00 | -1.29% | 2.74% | 51.0 | 16.6 | 0.27 | -21.76 |
|---|
After a resilient May, BNB is navigating another period of consolidation just beneath its monthly high of $697.70, trading near $657 amid modest pullback pressures. Despite a lackluster -1.3% performance over the past week, the longer-term trend remains constructive—BNB clocks in a robust 7.6% yearly gain and is up over 2.7% this month. It’s holding above its crucial short-term moving averages, a sign that market structure is intact even as traders gauge the next move. All eyes are on whether BNB can build fresh momentum to challenge its psychological resistance just under $700. As volatility compresses and traders weigh the recent range, there’s a palpable tension: is this just a pause before breakout, or early symptoms of a deeper retracement?
Digging into the technicals, trend indicators show BNB’s uptrend remains in play, with positive directional strength holding above negative while the average trend strength signals persistence. The weekly MACD is showing early signs of acceleration, but the daily reading is flattening out—so bullish conviction is present, but faltering in the short term. Oscillators such as RSI hover just below the overbought threshold, suggesting there’s room for another leg up if buyers step in decisively. However, a deep dip in momentum readings warns against complacency; profit-taking could drive BNB down toward its first major support near $646 if bids thin out. If bulls can flip the $697 resistance decisively into support—especially with rising volumes—all signs point to a breakout targeting the $760 zone. On the flip side, failure at these levels risks an extended fall back toward the $595–$600 cluster. With BNB coiling at a critical inflection point, I’m on alert—breakout traders should watch for a surge, but nimble stops are non-negotiable here.
UNUS SED LEO (LEO) Price Analysis
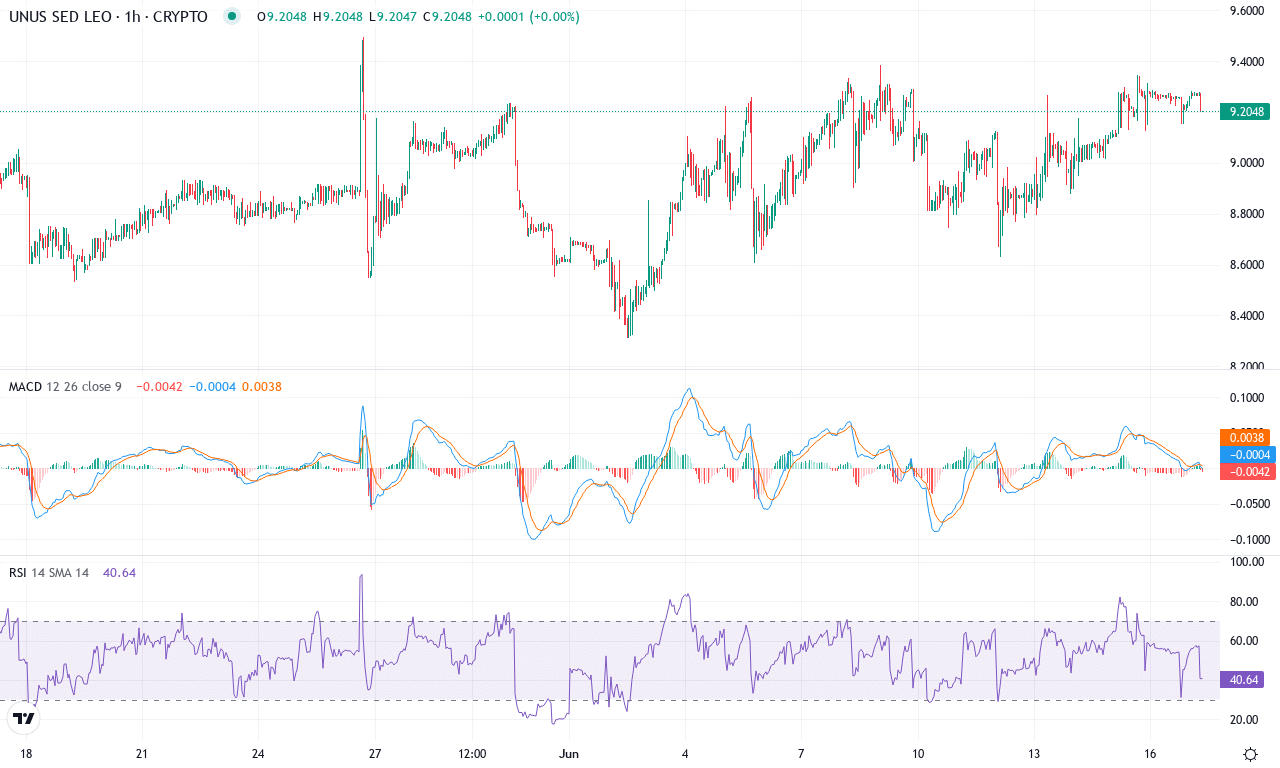
| Crypto | Close | 1W% | 1M% | RSI | ADX | MACD | CCI 20 | UNUS SED LEO(LEO) | $9.20 | 1.14% | 2.89% | 55.5 | 9.5 | 0.08 | 105.99 |
|---|
After an extended period marked by sharp retracements and low volatility, UNUS SED LEO (LEO) appears to be regaining composure with a subtle yet notable uptick. The past week delivered a modest gain, while a monthly climb of nearly 3% puts LEO back on the radar for disciplined traders monitoring rotation plays. Price action remains steadfast near $9.20, though it’s still boxed in by this month’s $9.50 high and $8.30 low—a relatively tight range for LEO, considering the backdrop of broader market turbulence. Seasoned traders will recognize the resilience here: after a challenging quarter, LEO has managed to post a year-on-year surge exceeding 56%, a testament to consistent demand despite periodic risk-off moods. I have to admit, the steadfastness in LEO’s price feels almost comforting amid crypto’s rollercoaster landscape.
Diving into the technicals, the trend indicators are holding firm—the directional movement index favors bulls, and a firm ADX points to a stable, if not explosive, trend. The weekly MACD flattens but just crept back above its signal line, hinting at nascent upside momentum; meanwhile, oscillators like the RSI are sitting calmly around the mid-50s, far from both overheated and oversold extremes. LEO is hugging its short-term moving averages, with price action cushioned above the 10-day and 20-day EMAs, signalling short-term support in the mid-$9s. Overhead resistance emerges near the $9.35–$9.50 zone—a breakout here could trigger a swift push toward the psychological $10 mark. On the downside, the $8.80–$8.75 level is shaping up as solid near-term support; failure to hold this area risks a steep correction toward $8.05 or even $7.50 if sellers regain the initiative. For now, as LEO consolidates, all eyes are on whether bulls can summon enough conviction to clear resistance and start a fresh leg up—I wouldn’t rule it out given the technical outlook.
Can Bitcoin Break Through?
Bitcoin’s notable ascent toward $112,000 faces potential resistance, with momentum needing sustenance to clear this mark. Meanwhile, BNB and LEO linger just below their breakout catalysts, poised yet cautious. Whether bulls can maintain strength or succumb to selling pressure hinges on upcoming sessions and market sentiment.