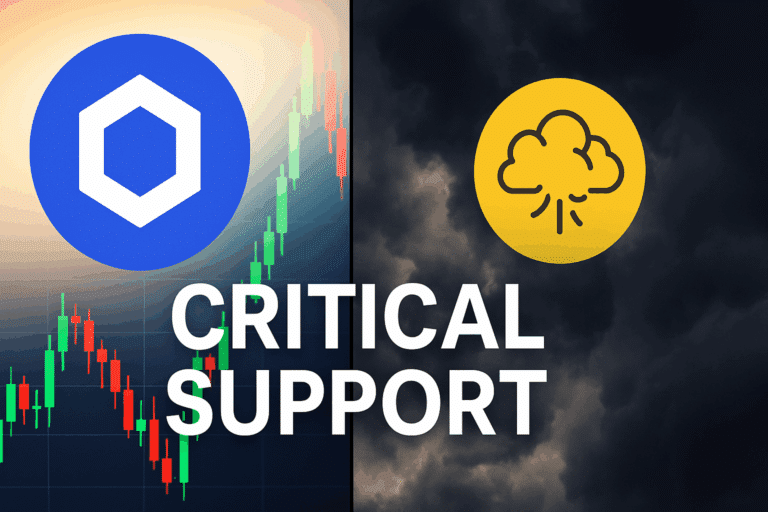
Solana, Litecoin, And Chainlink Teeter At Key Support As Bulls And Bears Prepare For A Sudden Volatility Surge
Solana, Litecoin, and Chainlink have been dancing on the precipice of their key support levels, setting the stage for potential fireworks in the crypto market. Recent trading has left these assets teetering: Solana has unwound months of gains, Litecoin faces mounting resistance, and Chainlink steadies itself after relentless selling. As prices inch closer to their critical psychological markers, the pressure is mounting for both bulls and bears. Will resilience override retracement, or are we poised for a deeper correction ahead? Let’s break down the technical setup across the board.
Solana (SOL) Price Analysis
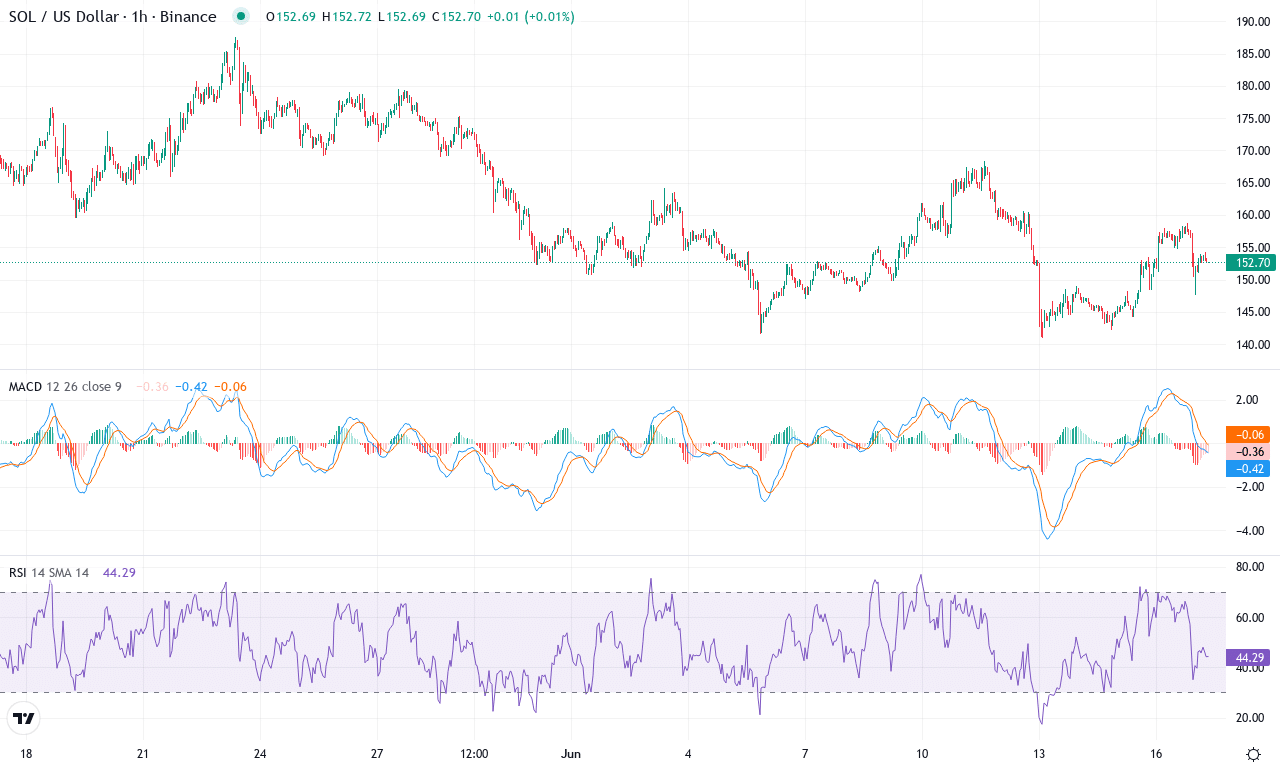
| Crypto | Close | 1W% | 1M% | RSI | ADX | MACD | CCI 20 | SOLANA(SOL) | $152.94 | -5.08% | -7.86% | 46.7 | 16.5 | -3.01 | -42.50 |
|---|
After a powerful three-month rally that catapulted Solana over 22% higher, momentum has cooled dramatically this month. Bears have taken the reins, knocking SOL down by nearly 8% and dragging it towards the lower bounds of its recent range near $140.88. The weekly chart reveals that this pullback isn’t just noise—short-term performance dipped over 5% and recent price action failed to reclaim key moving averages. For traders who’ve watched SOL’s spectacular rise and sharp retracements, this juncture feels pivotal: the exuberance of early-year gains is giving way to a tense standoff between profit-takers and those betting on a bounce-back rally.
The technical outlook suggests headwinds are mounting. Trend indicators point to fading bullish momentum; the ADX, while still elevated, shows a weakening trend, and sellers clearly have the upper hand as evidenced by the negative directional movement. The MACD on the weekly and daily timeframes is sloping downward, signaling that bearish momentum is intensifying, while oscillators have shifted from bullish to indecisive, hinting at exhaustion among buyers. With SOL trading below its major moving averages and hugging key psychological levels near $150, the next support zone sits ominously at $140—fail to hold here, and risks extend toward a steeper correction down to $136 or even $116 should panic selling set in. On the flip side, should bulls muster the strength to reclaim $162, it would invalidate the bearish reversal thesis and set sights on $182 and possibly back toward the $188 highs. In this kind of market, decisiveness matters—keep an eye on volume and volatility, because the next breakout (or breakdown) will be swift.
Litecoin (LTC) Price Analysis
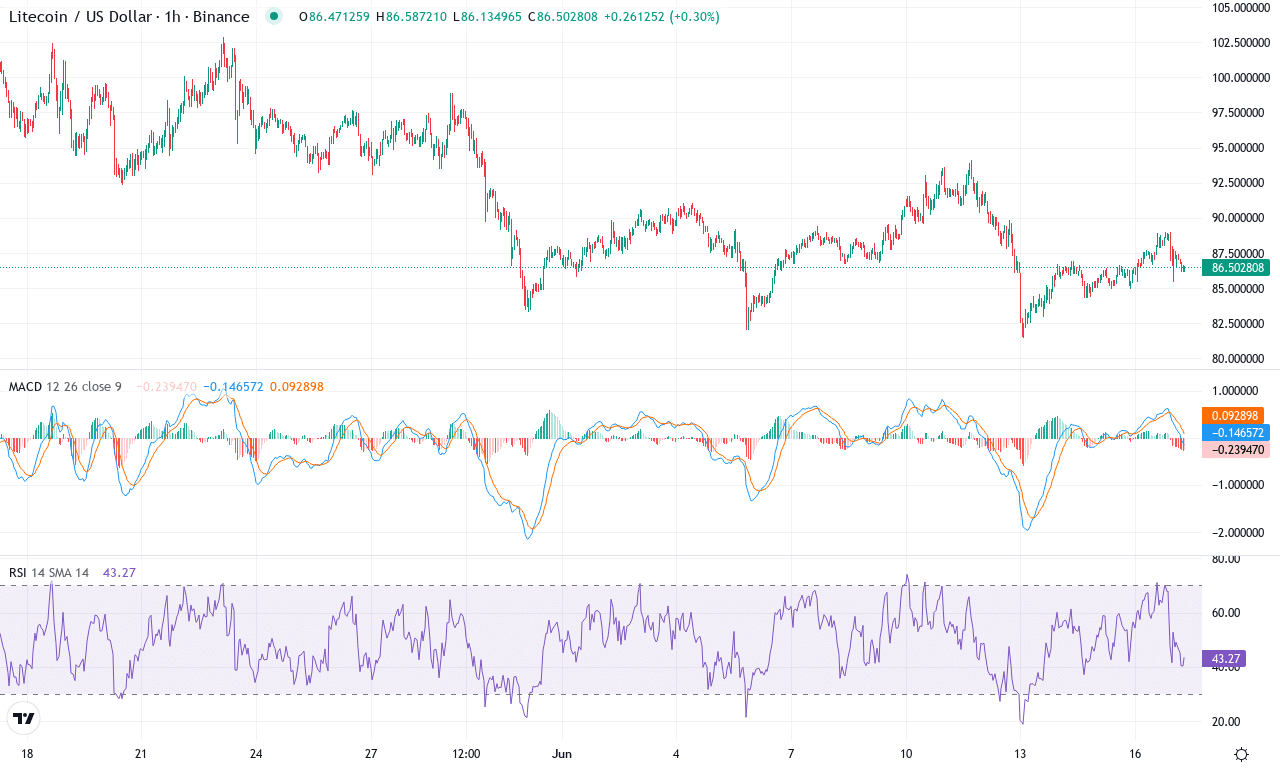
| Crypto | Close | 1W% | 1M% | RSI | ADX | MACD | CCI 20 | LITECOIN(LTC) | $86.44 | -4.85% | -9.99% | 44.2 | 19.4 | -1.59 | -55.43 |
|---|
After a lackluster stretch, Litecoin is struggling to regain its footing in the broader crypto market. The coin’s monthly performance reveals almost a 10% slide, punctuated by a sharp retreat from highs above $102 down to lows near $81. Even on the weekly frame, Litecoin hasn’t escaped the sell pressure, slipping nearly 5%. Price now hovers around $86, sandwiched between persistent sellers above and fragile support beneath. This stalling action is particularly disheartening for bullish traders banking on a reversal, especially with the longer-term outlook weighed down by a 20% drawdown over six months, despite a still-impressive yearly gain. Put simply: momentum is absent, trend signals are mixed, and new catalysts are needed to revive sustained upside.
Peeling back the technical layers, trend indicators suggest Litecoin remains caught between conflicting forces. The ADX shows only modest trend strength, and negative directional signals are nudging higher—a classic sign that bearish momentum could intensify if support cracks. The MACD lines have rolled over, with bearish convergence deepening on both daily and weekly timescales, while oscillators like RSI sit in the mid-40s, hinting at lackluster momentum but not true oversold conditions. Critically, Litecoin is stuck just under its key short-term moving averages, with the 10-day EMA capping price action and the 20- and 30-day EMAs clustering above. Nearby pivot levels put resistance just above $102—a psychological level that needs to be overcome to spark renewed bullish momentum. On the downside, $81 stands as vital support; a break here risks an extended fall toward $76, and bears could seize control. If—just if—buyers can flip $102 into a floor, the next upside target lands at $117. Right now, though, the technical outlook suggests caution is warranted, as Litecoin walks a tightrope between relief bounce and deeper correction. I’m watching the next few sessions intently—this range won’t last forever.
Chainlink (LINK) Price Analysis
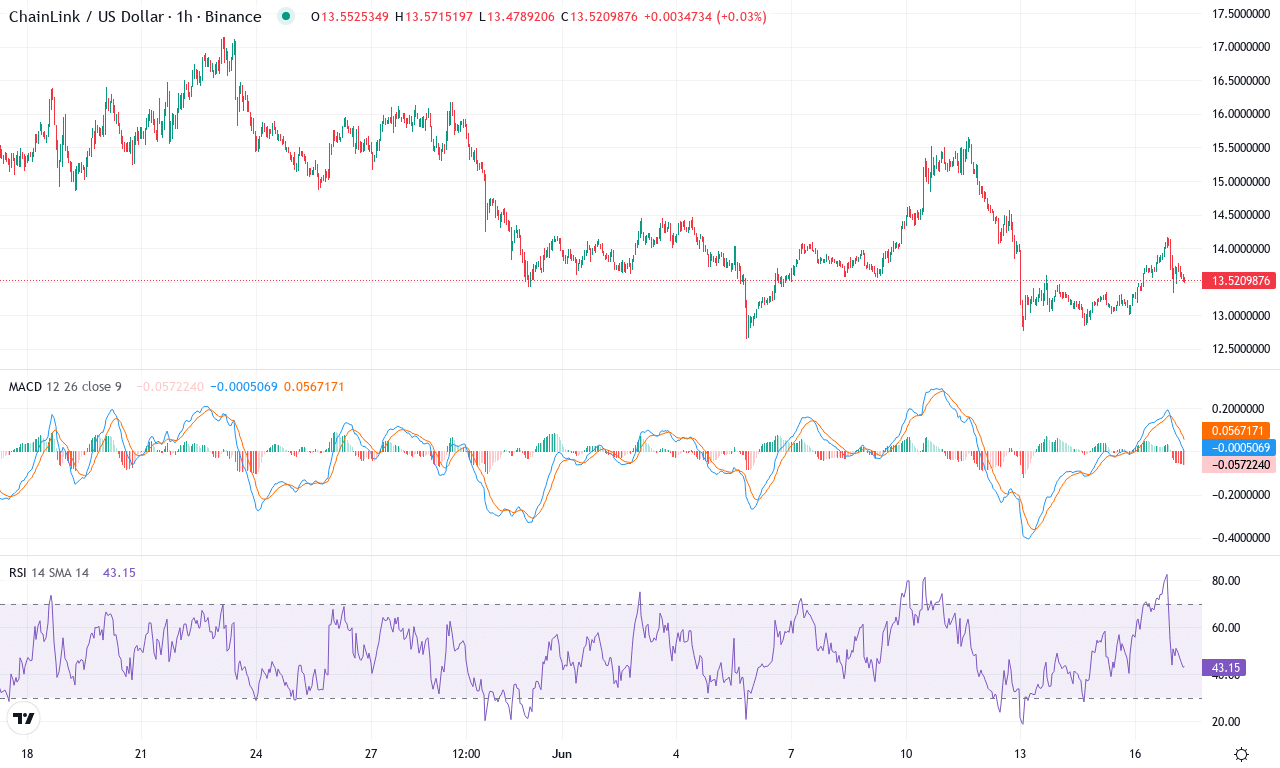
| Crypto | Close | 1W% | 1M% | RSI | ADX | MACD | CCI 20 | CHAINLINK(LINK) | $13.51 | -5.81% | -11.86% | 43.2 | 18.4 | -0.40 | -59.21 |
|---|
After months of relentless selling pressure, Chainlink is finally showing some resilience—even if the price action still feels heavy. This past week saw LINK drop nearly 6%, capping off a bruising month that’s left the token nearly 12% lower and deepening the pain for holders riding a staggering 46% six-month drawdown. Yet, with prices holding well above the recent monthly low near $12.65 and refusing to slip below key psychological support at $13, there’s a hint that sellers may be running out of steam. If you’ve endured the recent turbulence, you’re probably watching for a decisive shift—because capitulation fatigue often precedes opportunity.
Technically, LINK’s trend indicators remain tilted to the downside, but short-term oscillators are flashing subtle signals of stabilization. The trend strength readings reflect a prevailing bearish momentum, but with a small divergence: bearish fuel is fading as the MACD histogram edge narrows, while the weekly MACD shows less negative acceleration. Momentum oscillators are pressing upward from oversold territory, and the recent bounce from monthly lows coincides with LINK defending its 200-day exponential moving average. However, the hovering RSI in the mid-40s tells us the bulls haven’t reclaimed control just yet—this is still a market wrestling for direction. If buying momentum persists and bulls push LINK above resistance near $15, the door reopens for a rally towards $16.80. But failure to hold above $13 risks an extended fall towards the monthly low at $12.65 or lower. This is a pivot zone for LINK—stay nimble, because whichever side wins here could dictate the next major move.
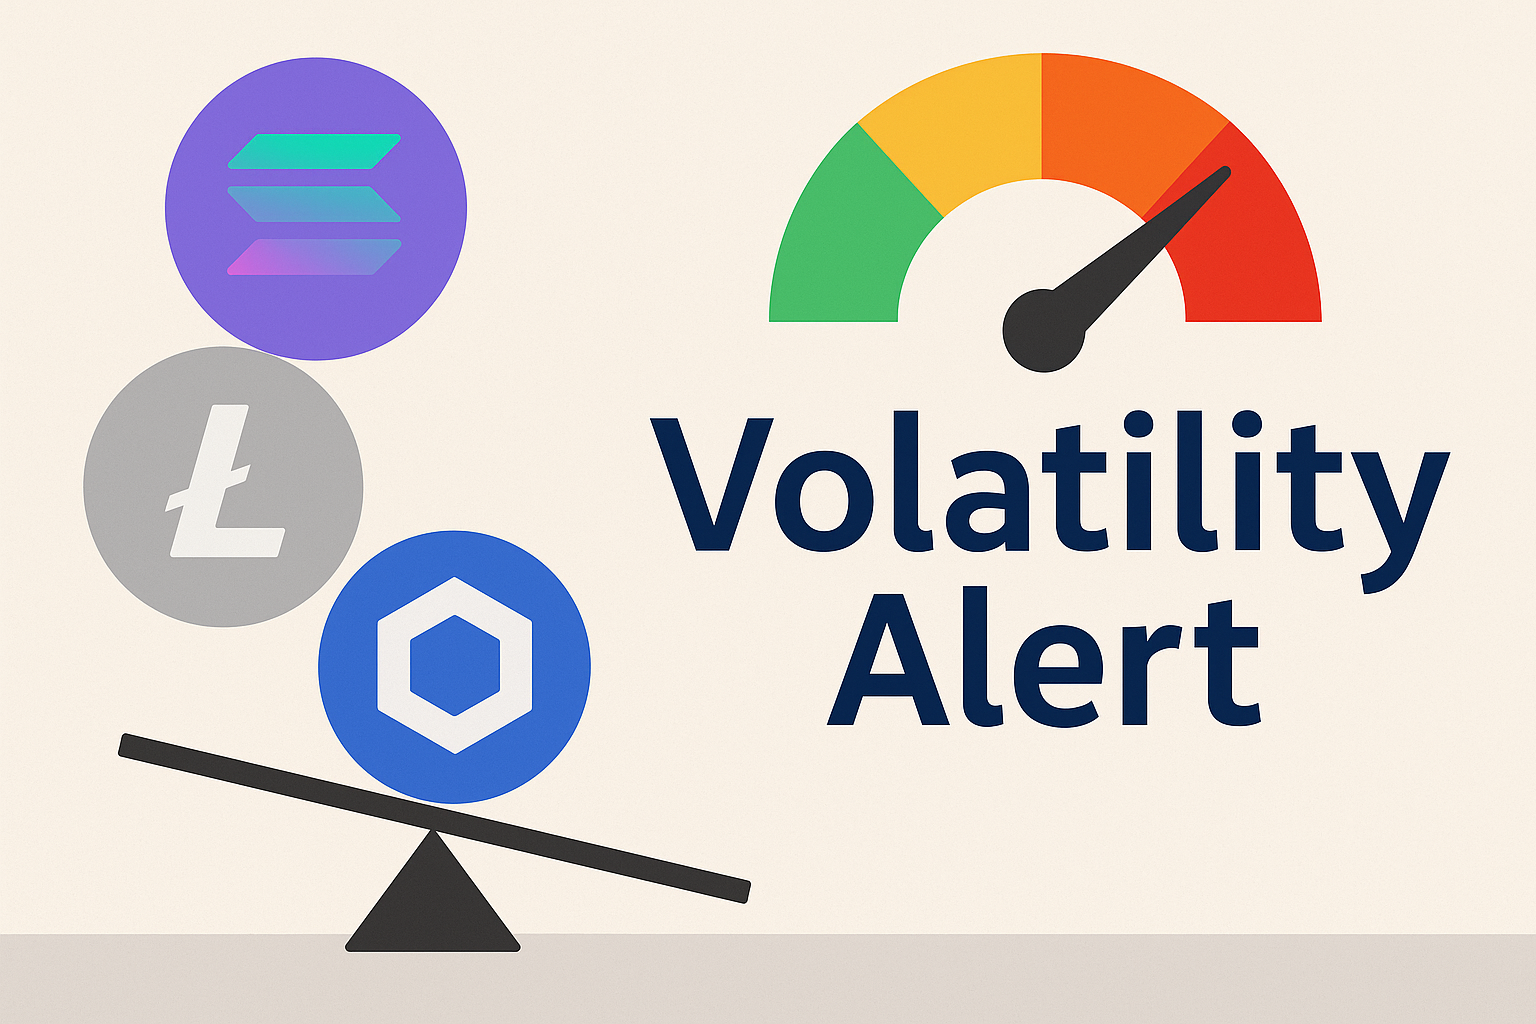
Prepared for a Volatility Spike?
Solana hovers around crucial support, and Litecoin battles to stay above its resistance threshold, indicating pivotal moments ahead. Meanwhile, Chainlink is stabilizing but remains vulnerable to fluctuations. As tension builds at these junctures, the market is on edge, awaiting an imminent burst of volatility that could dictate the next major move. Traders should brace for fast shifts as sentiment sways at these critical levels.