Ethereum, BNB, and Maker Teeter at Major Inflection Points as Volatility Threatens Sudden Breakout or Collapse
After Ethereum’s modest 1.3% gain over the past month, the crypto landscape faces increased turbulence following recent liquidations and a 10% weekly decline. Mirroring this volatility, both BNB and Maker display diverging technical setups amidst heavy market pressure, with ETH and BNB trapped between crucial resistance and support levels. As we navigate these pivotal inflection points, the key question remains: Can buyers muster the strength to turn the tide, or is a deeper correction looming on the horizon? Let’s break down the technical setup across the board.
Ethereum (ETH) Price Analysis
| Crypto | Close | 1W% | 1M% | RSI | ADX | MACD | CCI 20 | ETHEREUM(ETH) | $2533.54 | -10.01% | 1.33% | 49.6 | 17.3 | 26.81 | -47.24 |
|---|
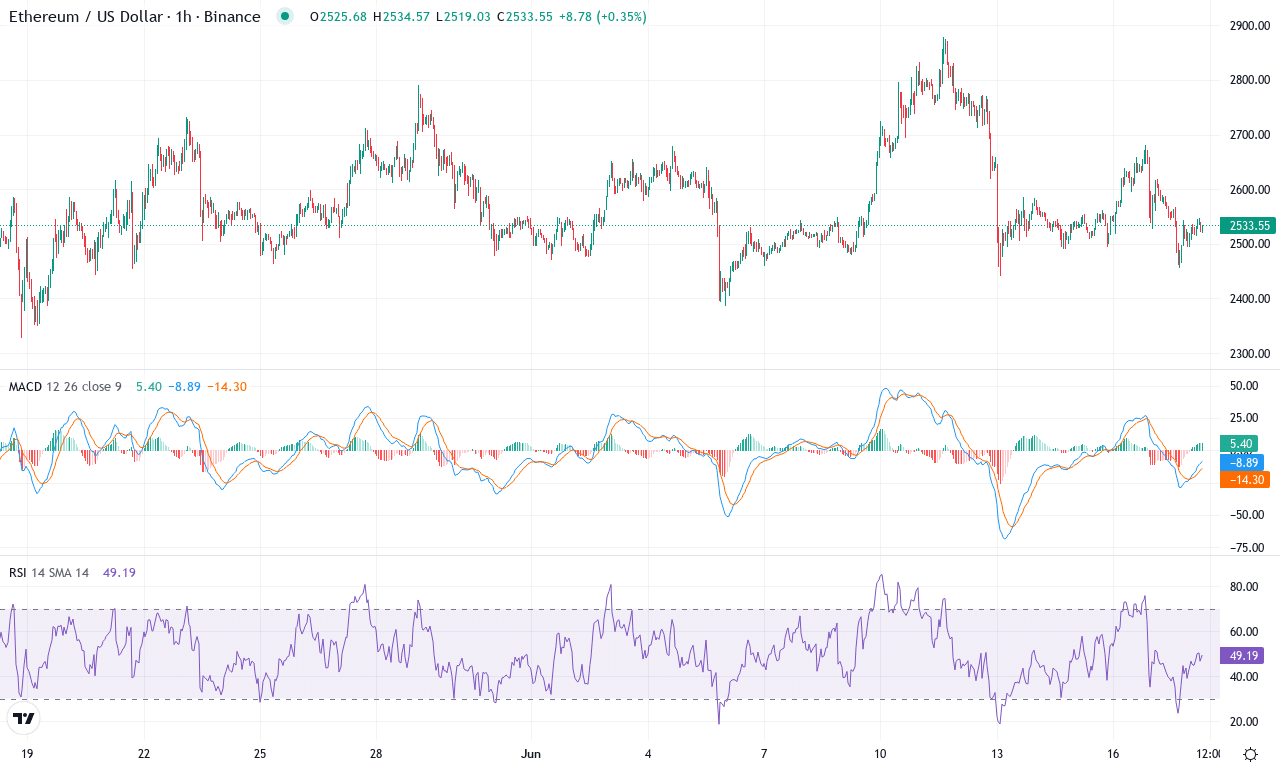
After a month marked by sharp volatility and a turbulent 10% weekly decline, Ethereum finds itself at a critical crossroads. Despite putting in a modest 1.3% gain over the past month, the broader context reveals instability—ETH remains well off its highs and lags by a steep 25% over the last six months. The technical outlook suggests that buyers are attempting to regain control after recent long liquidations and profit-taking, but sentiment is fragile. I can feel the tension here as price action wavers near the $2,533 mark, with ETH squeezed between heavy resistance just below $2,900 (the monthly high) and vulnerable support near $2,370 (recent low and the 100-day EMA). If selling intensifies from here, risks of an extended fall loom large, but a fresh surge could shift the narrative in bulls’ favor.
Digging into the technicals, oscillators and trend indicators paint a conflicted, high-stakes picture. The average directional index is elevated, signaling strong trend strength, but both positive and negative directional components are clustered—suggesting a battle for momentum. The weekly MACD shows deep acceleration to the downside, indicating that bearish momentum is currently overwhelming. However, on shorter timeframes, some oscillators hint at nascent recovery: the RSI is ticking upwards from oversold territory, and ETH is fighting to reclaim ground above its key moving averages. A close above $2,880 would invalidate the bearish thesis and open the door for a rally towards $3,400, while continued rejection here could trigger a steep correction back to $2,370 or even lower. With volatility surging and the market at an inflection point, I’m watching support and resistance like a hawk—do not underestimate the emotional rollercoaster this setup might deliver.
BNB (BNB) Price Analysis
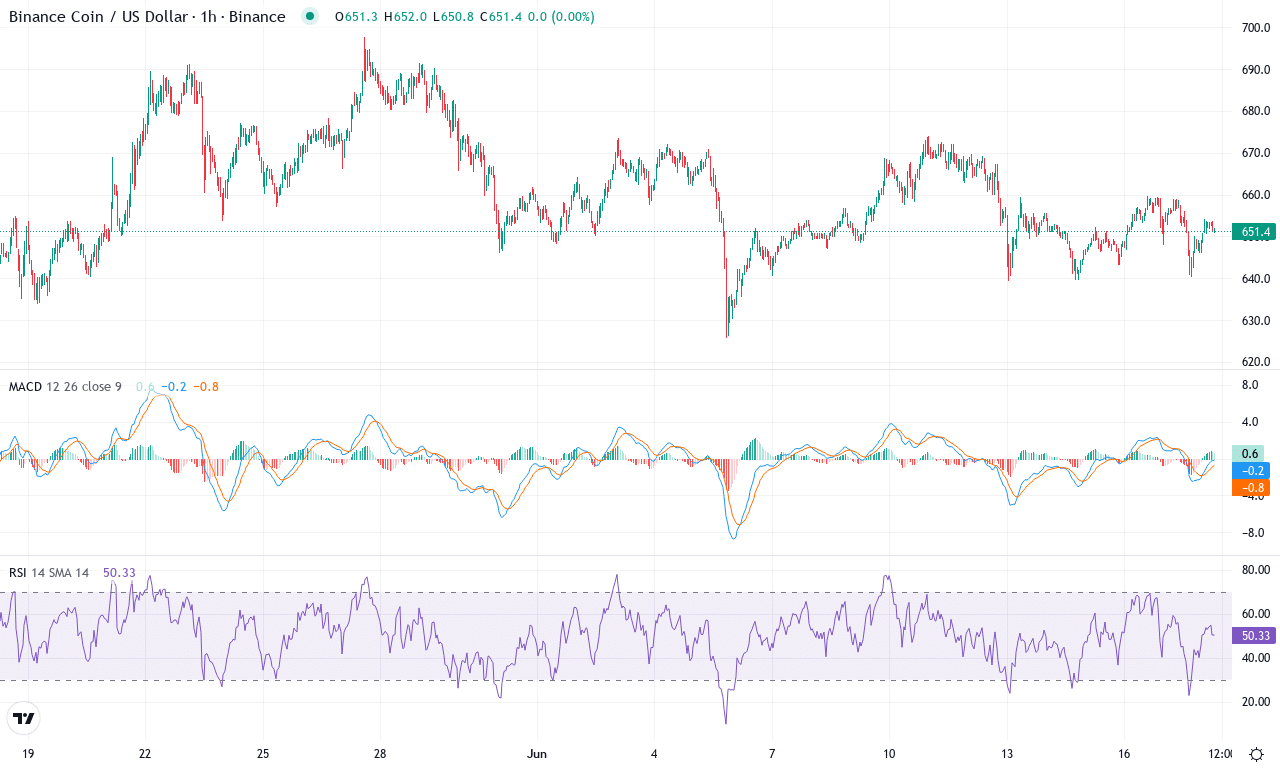
| Crypto | Close | 1W% | 1M% | RSI | ADX | MACD | CCI 20 | BNB(BNB) | $651.40 | -3.25% | -0.12% | 48.4 | 16.8 | -0.59 | -39.89 |
|---|
After a modest run earlier in the quarter, BNB’s price action has turned choppy, underscoring trader uncertainty as the token hovers around $651. Notably, BNB’s monthly performance is barely negative, down just 0.12%, while the weekly slide of over 3% hints at intensifying short-term pressure. Although the year-to-date momentum remains positive—climbing over 7%—the short-term tone feels uneasy. We’re witnessing BNB pinned between last month’s high near $698 and a firm support zone just above $625, with volatility simmering beneath the surface. If the market delivers a decisive push in either direction, fireworks could follow; I’m on edge watching for that break.
Diving deeper into the technicals, BNB’s trend indicators paint an ambiguous picture. The ADX signals a maturing trend but the relatively high negative directional index shows sellers are gaining traction. Meanwhile, the MACD line just edged below its signal line on the weekly chart, a classic bearish trigger—always a wake-up call for longs. Oscillators are flashing mixed signals: the RSI has cooled off to a middle ground, dissipating prior overbought stress, while the Stochastics and CCI further confirm sideways momentum. Price is clinging to major moving averages, particularly the cluster between $638 and $654, making the $646–$654 band an immediate battleground. If bulls can reclaim resistance at $709, that unlocks the wider $760 level; on the flip side, a breakdown below $625 exposes BNB to a steeper correction toward $596 and even $533. Until conviction returns, quick reversals are likely—I’m cautious but watching for an explosive move either way.
Maker (MKR) Price Analysis
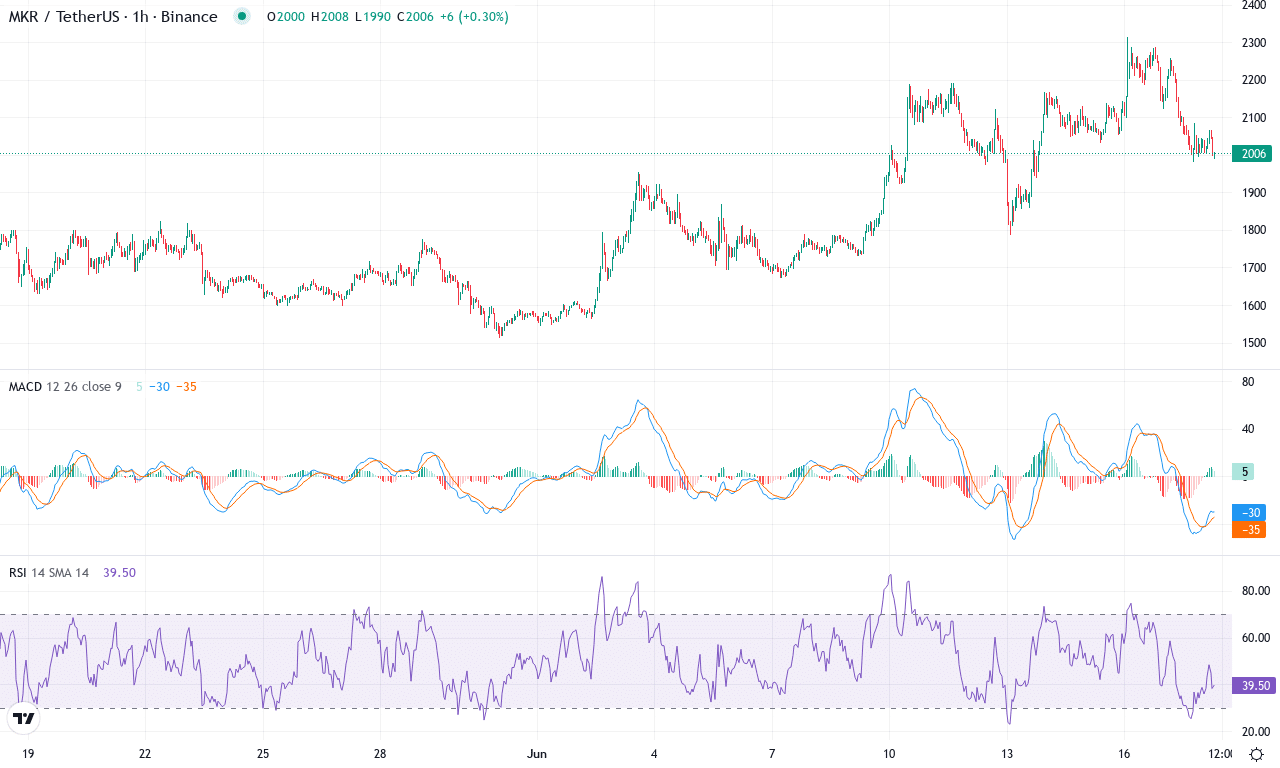
| Crypto | Close | 1W% | 1M% | RSI | ADX | MACD | CCI 20 | MAKER(MKR) | $2004.00 | -6.57% | 14.84% | 55.9 | 23.7 | 106.94 | 50.62 |
|---|
After a head-turning 55% rally over the past quarter, Maker (MKR) is entering June with renewed volatility and a sharp 14.8% monthly surge. This latest leg higher has pushed the token close to the upper bound of its monthly range, repeatedly testing resistance near $2,314. Recent price action has shifted from exuberant highs to a measured pullback, with bears managing a 6.5% drop in the last week—yet even so, the broader trend remains clearly bullish by any technical measure. I’m not surprised to see profit-taking after such explosive gains, but so far, there’s little to suggest a steep correction is imminent. MKR is now consolidating above key moving averages, distilling a sense of fragility and underlying strength—almost as if the market is catching its breath before the next directional move.
The technical backdrop still leans bullish, with trend indicators showing remarkable momentum; the average directional index remains elevated and the positive trend component is comfortably outpacing negative directional forces. Significantly, the weekly MACD continues to accelerate higher while oscillators remain supportive, though not quite in overbought territory. RSI hovers near 60, a zone that often precedes explosive breakouts when momentum builds. MKR is trading well above all major exponential moving averages and the volume-weighted metrics—a clear signal that bulls remain firmly in control. Immediate resistance sits at $2,314, while psychological barriers near $2,400 could spark sharp volatility if breached. On the flip side, if sellers regain the upper hand, the first major support appears around $1,900, coinciding with the top end of the prior consolidation zone and key moving average clusters. If MKR can reclaim its monthly high and push through resistance, I’d be watching $2,700 as the next technical upside target. But if broader risk assets falter, expect a pullback toward $1,750–$1,650—a healthy reset, not a cause for panic. If you’re already in, keep stops tight and eyes peeled; big inflection points often reward the patient and punish the reckless.
Navigating Volatility’s Crossroads
Ethereum hovers at resistance, while BNB struggles to maintain support, both exhibiting potential for sudden swings with volatility rising. Maker’s divergence adds complexity, but a breakout above its current consolidation could be pivotal. The coming days will clarify if bulls can reclaim control, or if deeper corrections are imminent, as traders watch for definitive moves.