Injective, Pendle, and Curve DAO Teeter at Critical Support as Bears Threaten Deep New Lows
In a landscape riddled with uncertainty, Injective, Pendle, and Curve DAO are at critical inflection points. Recent sharp declines have erased weeks of gains, putting all three tokens in a precarious position amid bearish pressures. As each asset tests vital support levels, traders face the pivotal question: will this market correction deepen, or is a reversal on the horizon? Let’s break down what the key indicators are suggesting now.
Injective (INJ) Price Analysis
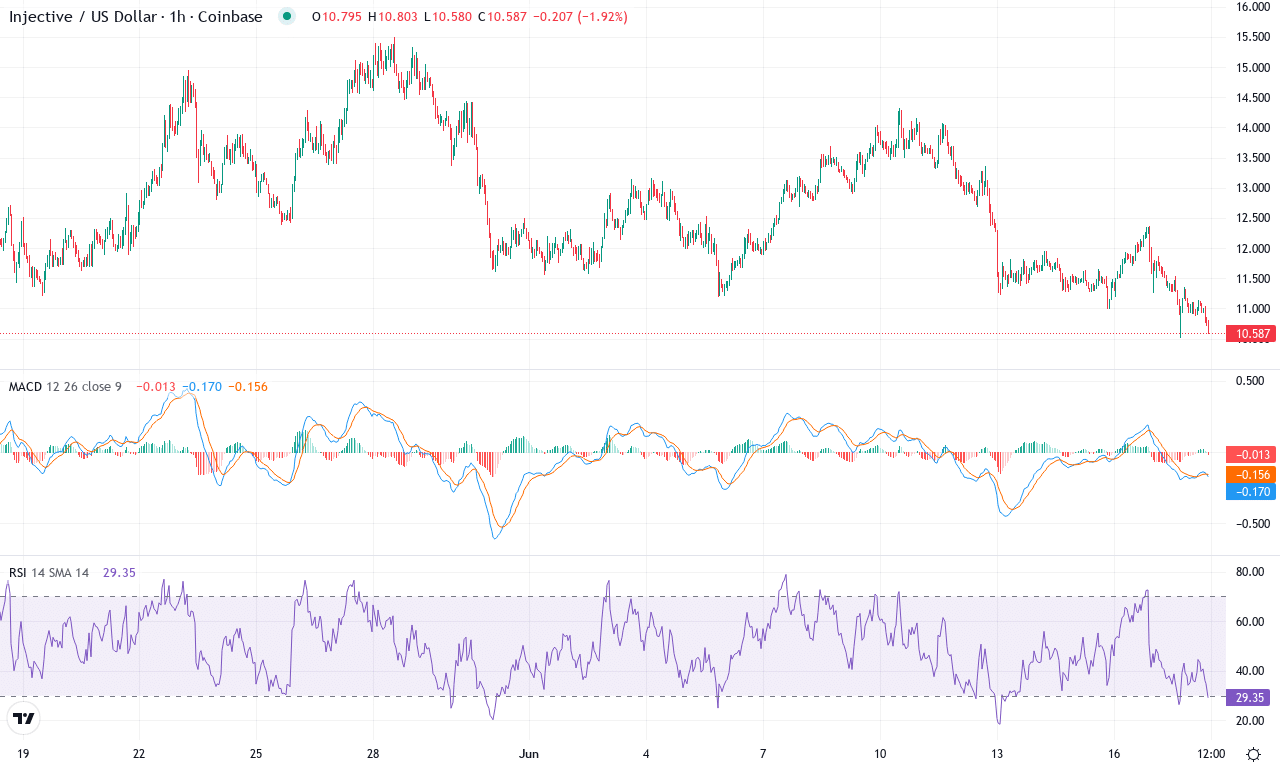
| Crypto | Close | 1W% | 1M% | RSI | ADX | MACD | CCI 20 | INJECTIVE(INJ) | $10.65 | -24.17% | -14.02% | 38.3 | 16.9 | -0.31 | -139.47 |
|---|
After a punishing few weeks, Injective (INJ) is wrestling with major headwinds and volatile price swings. The token tumbled nearly 24% in the past week and is now over 14% lower for the month, undercutting what little optimism remained from its modest Q2 recovery. Bulls watched in frustration as INJ sank from a monthly high near $15.50 down to just above $10.50, reversing nearly all progress from the last three months and sitting more than 50% below its 6-month peak. The technical outlook suggests sellers are regaining control, forcing INJ to retest crucial support near $10.50—a zone that, if lost, risks a cascade of stop-losses and fresh downside momentum. For those of us riding this turbulence, it’s a test of patience and discipline: you’re not in the red until you sell, but these swings certainly jangle the nerves.
Technically, the trend indicators keep flashing caution. The average directional index is well above trendless territory—yet the red flags keep stacking up, as negative momentum readings and sharply rising bearish oscillator signals hint at a developing downside extension. The MACD continues to track below its signal, and with both the weekly and daily momentum swerving negative, attempts at a relief rally have fizzled. INJ is now trading well below its key short-term moving averages, and the 10- and 20-day exponential averages are rolling over, confirming the loss of bullish momentum. Below current levels, $10.50 stands as last-ditch support; a close beneath it opens the door to a possible steep correction toward round numbers—$8.80 and even $5.50 could come into focus if bears really press their advantage. On the flip side, sustained buying above the $13.00–$13.50 pivot is necessary to invalidate the bearish reversal setup and reignite breakout momentum, with resistance around $15.50 as an aspirational target. All signs favor caution until strength returns. If sellers overwhelm $10.50, risk management trumps hope—keep your stops tight.
Pendle (PENDLE) Price Analysis
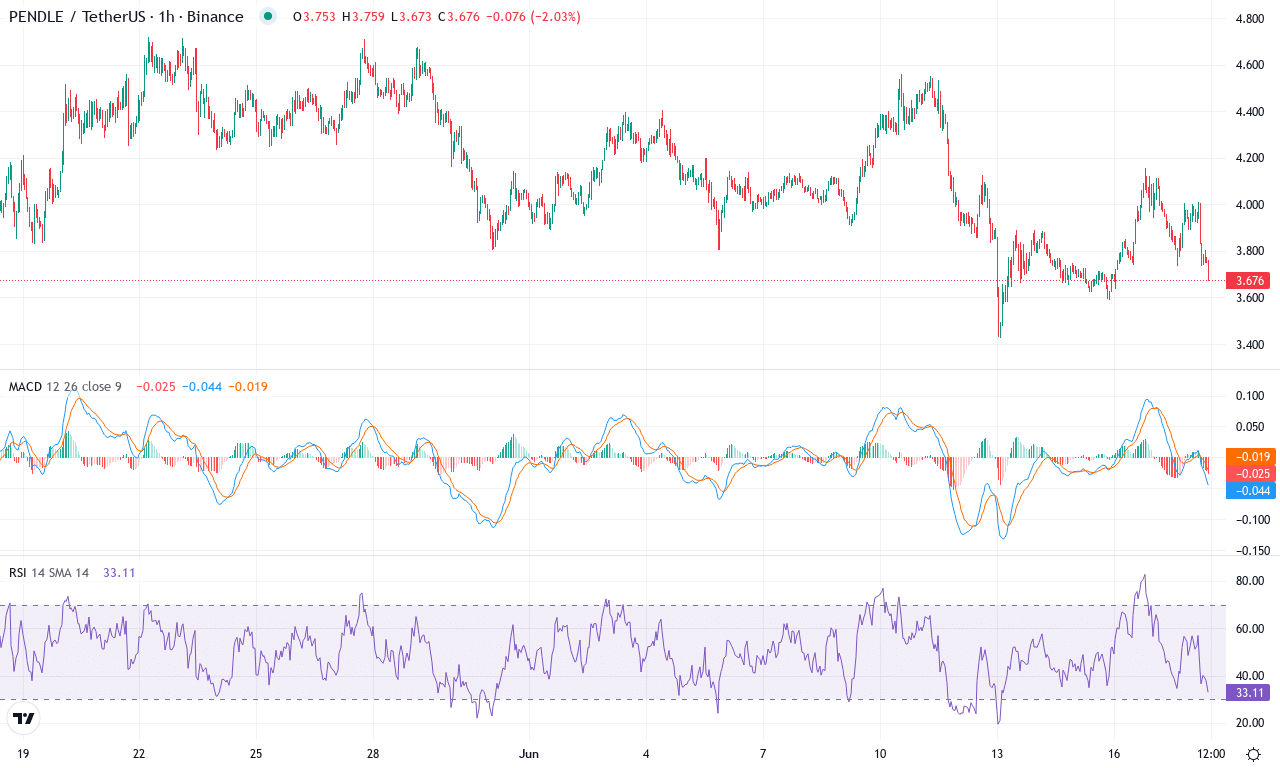
| Crypto | Close | 1W% | 1M% | RSI | ADX | MACD | CCI 20 | PENDLE(PENDLE) | $3.71 | -17.21% | -11.41% | 42.9 | 15.1 | -0.06 | -98.07 |
|---|
Pendle has faced a steep correction this week, tumbling over 17% and snapping its previous three-month winning streak. After a period of explosive gains—up nearly 47% over the past quarter—the latest pullback is a reality check for momentum traders. The technical outlook suggests a shift in the tide, with short-term sentiment clearly on edge after a failed push toward the $4.72 monthly high. With the close price now hovering closer to $3.70 and slicing beneath mid-range moving averages, bulls seem to be on the defensive, and I’ll admit—it’s nerve-wracking to watch such sharp post-rally reversals unfold. Pendle’s 1-month performance has dropped over 11%, dragging year-to-date returns deep in the red and raising questions about whether the December boom marked a local top.
Trend indicators are flashing warning signals: the ADX remains high, but with the negative directional component overpowering the positive, suggesting downside pressure is in control for now. The MACD shows convergence after riding high in recent weeks, reinforcing the idea that bullish momentum has fizzled and a trend reversal is likely materializing. Oscillators support this cautionary stance, as the RSI has retreated to the mid-40s, and both the stochastic and Williams %R signal oversold territory—yet with no strong evidence of a pending bounce just yet. With Pendle now trading below its key moving averages, the next significant support sits near $3.14; failure to defend this area risks an extended fall toward $2.29, the monthly S2. On the upside, bears may lose their grip if buyers reclaim levels above $4.00—the first major resistance before a possible return to the $4.70 high. All eyes are on price action at these pivotal zones; as always, don’t let short-term volatility shake your resolve, but stay nimble—the tape is telling us to respect renewed risks ahead.
Curve DAO Token (CRV) Price Analysis
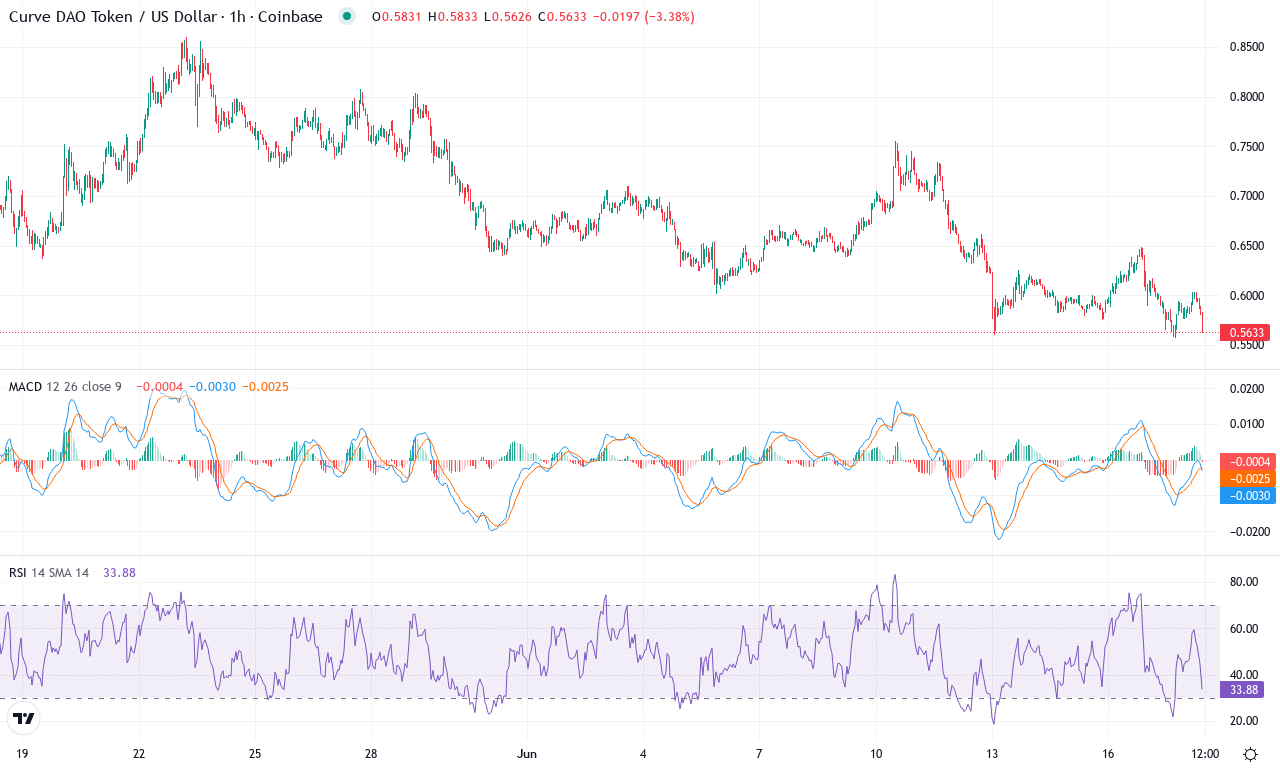
| Crypto | Close | 1W% | 1M% | RSI | ADX | MACD | CCI 20 | CURVE DAO TOKEN(CRV) | $0.57 | -22.35% | -18.29% | 36.8 | 13.6 | -0.03 | -122.22 |
|---|
After a brutal stretch of volatility and long liquidations, Curve DAO Token (CRV) finds itself under heavy pressure yet again. The last week alone has seen CRV tumble more than 22%, extending its month-long drop to nearly 18% and wiping out much of its spring rebound. The steep correction comes even as yearly gains remain robust—the market is clearly punishing weak hands here, with bulls struggling to hold ground above support. As we approach psychological round numbers near $0.55, sentiment feels uneasy: heavy sell pressure is testing buyers’ resolve and bears sense momentum shifting in their favor.
The technical outlook suggests CRV is caught in a bearish reversal, but the drama isn’t over yet. Trend indicators show intensifying downward pressure: the weekly MACD has transitioned from mild bullishness back toward the bears, with oscillators turning negative and the Awesome Oscillator slipping below zero. Momentum remains noticeably weak, with the price drifting beneath key short-term exponential moving averages—a bearish tell. There’s little relief from oscillators either, as RSI hovers well below overbought conditions, confirming the exhaustion in buying interest. Major support is now stacked between $0.55 and $0.56; if this zone caves, risks of an extended fall to the $0.50 mark loom large. However, if dip buyers step in and CRV manages to reclaim the $0.66 resistance zone (lined up with monthly pivot and mid-term EMAs), a snapback rally could regain strength. Personally, I’m on edge here—this is classic make-or-break territory, and all eyes should be glued to the next decisive move.
Will Support Hold?
Injective hovers around its support, while Pendle seeks footing after a steeper drop. Curve DAO remains vulnerable unless it can bounce back quickly. Watch for sustained buying or a decisive close below these levels to clarify the ensuing trend; the potential for a deeper correction remains unless bulls reclaim control with renewed momentum.