Litecoin, PEPE, And ZEC Test Make-Or-Break Lows As Bears Push Support To The Brink
Litecoin, PEPE, and Zcash are all navigating treacherous waters as recent market dynamics push their support levels to the edge. Litecoin’s sharp 16% monthly drop mirrors the uneasy slide seen in PEPE and ZEC, each challenging the resolve of bulls and bears alike. As these cryptocurrencies flirt with critical levels, the question looms large: will current price supports hold or give way to deeper declines? Let’s break down the technical setup across the board.
Litecoin (LTC) Price Analysis

| Crypto | Close | 1W% | 1M% | RSI | ADX | MACD | CCI 20 | LITECOIN(LTC) | $84.39 | -9.52% | -16.57% | 41.1 | 20.5 | -1.87 | -113.74 |
|---|
After a punishing few weeks, Litecoin is feeling the heat, with the price dipping below $85 and logging a monthly drop of over 16%. Bears have clearly been in the driver’s seat as Litecoin surrendered the prior quarter’s gains, erasing any optimism from its strong yearly performance. Despite some reassuring macro stability earlier in the year, the recent sell-off sent LTC plunging from its recent $102 high to monthly lows near $81—a stark reminder that in crypto, bullish narratives can unravel quickly. As the dust settles, I sense the market is still digesting this volatility surge. The question now: are sellers exhausted, or are we bracing for an extended fall?
From a technical standpoint, trend indicators paint a sobering picture. Litecoin’s trend strength remains elevated, yet the negative direction is undeniable, evidenced by persistent bearish momentum across weekly and daily oscillators. The MACD continues to bleed lower, signaling acceleration to the downside—momentum is unmistakably with the bears. Price action remains stuck beneath all key moving averages, especially the 10- and 20-day EMAs, which have now converged well above current levels and act as immediate resistance. Support sits precariously in the $81–$84 zone—if sellers breach this buffer, a steep correction toward psychological $75 support is easily on the table. Still, with oscillators lingering in oversold territory and many short-term traders likely flushed out, conditions could ripen for a snapback rally if buyers reclaim $91. A sustained push above that mark might invalidate the bearish reversal and open the door to $102 once again… but for now, I’m cautious. In these choppy waters, discipline trumps hope—keep an eye on those inflection points.
Pepe (PEPE) Price Analysis
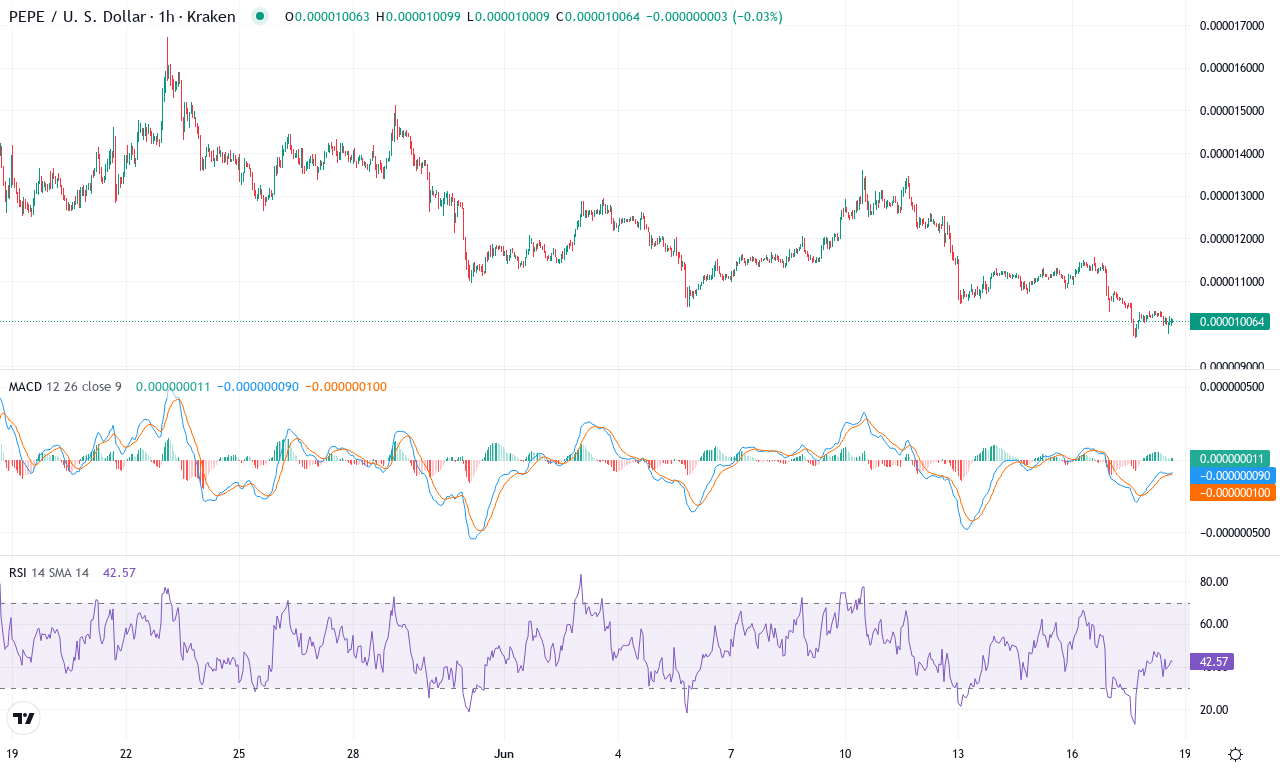
| Crypto | Close | 1W% | 1M% | RSI | ADX | MACD | CCI 20 | PEPE(PEPE) | $0.00 | -23.38% | -27.44% | 37.6 | 19.0 | 0.00 | -157.99 |
|---|
After a blistering three months that saw PEPE surge over 34%, the meme coin’s momentum has dramatically reversed. This past week alone, PEPE tumbled nearly 23%, capping off a brutal month where sellers hammered it over 27% lower. The technical outlook suggests that bullish momentum has all but evaporated for now; PEPE closed at $0.00001005, scraping along its monthly low while bulls scramble to defend key psychological territory. Speculators love volatility, but there’s no denying that the recent slide hints at long liquidations and a profit-taking surge by early entrants—painful for those late to the party, but the kind of shakeout that can precede a meaningful base if exhaustion sets in.
Delving into the charts, PEPE is sitting below all short-term exponential moving averages—a classic sign bears are in control. The moving average convergence/divergence is entrenched in negative territory, and oscillators reinforce that downward pressure, with RSI retreating sharply from overbought levels and trend indicators holding firm to the downside. Right now, PEPE is pinned near clutch support at $0.00000965; if this floor gives way, risks of an extended fall toward deeper support zones are real. However, if buyers can spark just enough momentum for a bounce, the first challenge is reclaiming the $0.000012 mark and then the $0.000014 range. All signs point to heightened volatility ahead—personally, I’m riveted to see who blinks first at these levels. If bulls mount a comeback, traders might sniff early signs with a shift in momentum, but until then, caution rules the day beneath every failed rally attempt.
Zcash (ZEC) Price Analysis
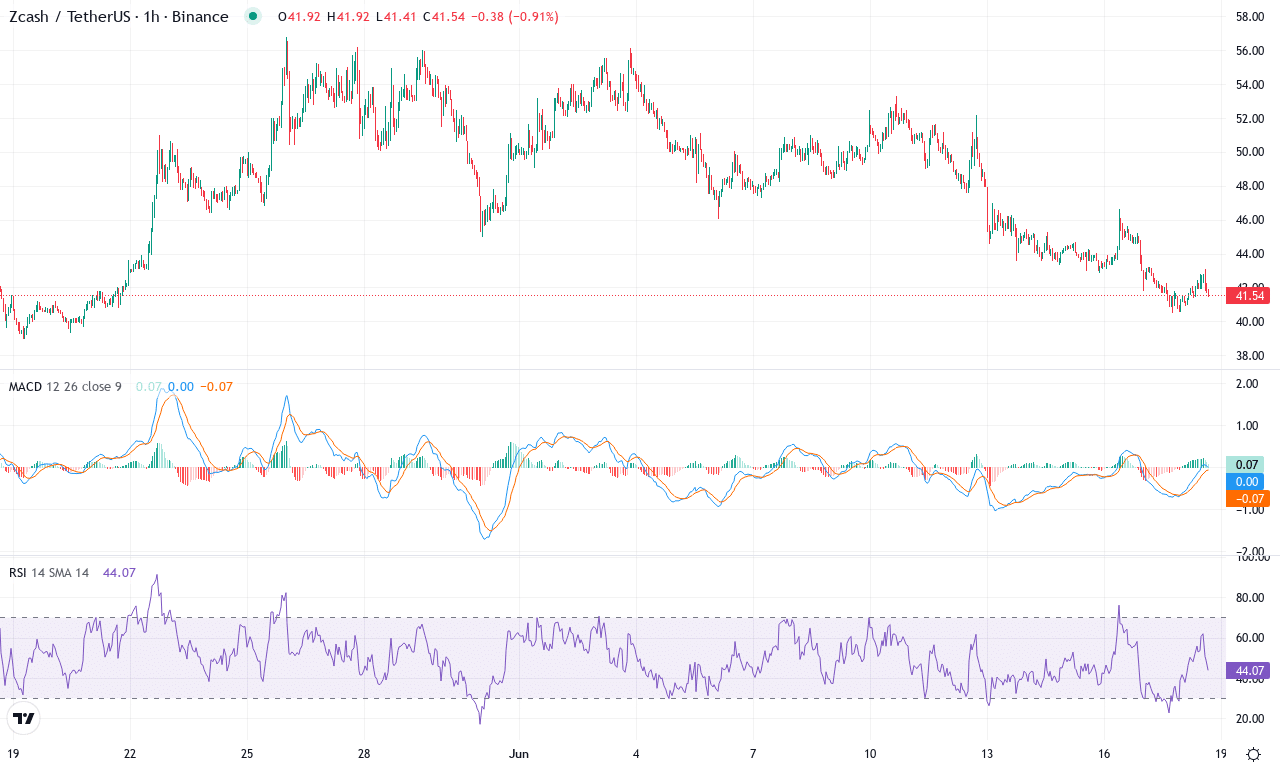
| Crypto | Close | 1W% | 1M% | RSI | ADX | MACD | CCI 20 | ZCASH(ZEC) | $41.52 | -19.92% | 0.24% | 38.1 | 21.1 | -1.09 | -148.10 |
|---|
After a volatile month defined by deep swings between $56.79 and $39.32, Zcash (ZEC) is struggling to regain its footing. The coin’s brief 0.2% monthly uptick is dwarfed by a bruising 20% drop over the past week—a sharp reminder of just how brutal crypto selloffs can be. Yet, in spite of the pain, Zcash’s yearly performance of nearly 91% remains impressive, a testament to its resilience through extended bear phases. As traders eye the current $41.52 close, the market sits almost perfectly on a knife’s edge, caught between profit-taking after Q1 optimism and the threat of a steeper correction if support buckles. I have to admit, moments like this get the adrenaline pumping; Zcash always seems to lure traders in with the promise of massive reversals, and right now the stakes are high for both bulls and bears.
Peeling back the technical layers, the mood is tense. Trend indicators show strong but waning bullish momentum: while the positive directional index remains above its bearish counterpart, it’s narrowing quickly—a sign that sellers are regaining control. The weekly MACD just flipped below its signal line, confirming the negative momentum and adding more weight to near-term bearish bets. Oscillators like RSI and CCI hint at oversold territory, but with Zcash poised slightly under its major short- and medium-term moving averages, a clean rebound isn’t guaranteed. Key support is stacked around $37, and if that crumbles, risks of an extended fall toward $24 intensify. Conversely, a bounce above the $47–$50 resistance band could reignite bullish momentum and open the door to a recovery rally near $60. Right now, the technical outlook suggests caution is warranted—traders shouldn’t chase every uptick, but the potential for dramatic whipsaws is very real. If ZEC snaps back into bullish alignment, you’ll hear me cheering on that breakout.
Can Support Levels Hold?
Litecoin appears to stabilize after its recent drop, while PEPE attempts to maintain its footing above crucial support. Zcash is at a pivotal moment, with bears testing its resolve. If current levels falter, downside risks may grow, yet a bullish defense could trigger a recovery rally. Traders are closely watching for signs of strength or weakness in the coming sessions to guide their strategies.