TAO AVAX and OKB Face Critical Inflection as Oversold Signals Collide With Intensifying Bear Pressure
As Bittensor (TAO) and Avalanche (AVAX) weather turbulent market conditions, there’s no shortage of tension across the crypto landscape. Both assets have endured recent dramatic downturns, with TAO plunging nearly 20% this month and AVAX dropping over 21%, pressing them against critical support zones. With TAO facing pressure from bears and AVAX flirting with potential further decline, these moves set the stage for crucial tests of resilience. As the technical indicators reveal, the market is at a crossroads—will these distressed assets find footing or continue to slide? Let’s break down the technical setup across the board.
Bittensor (TAO) Price Analysis
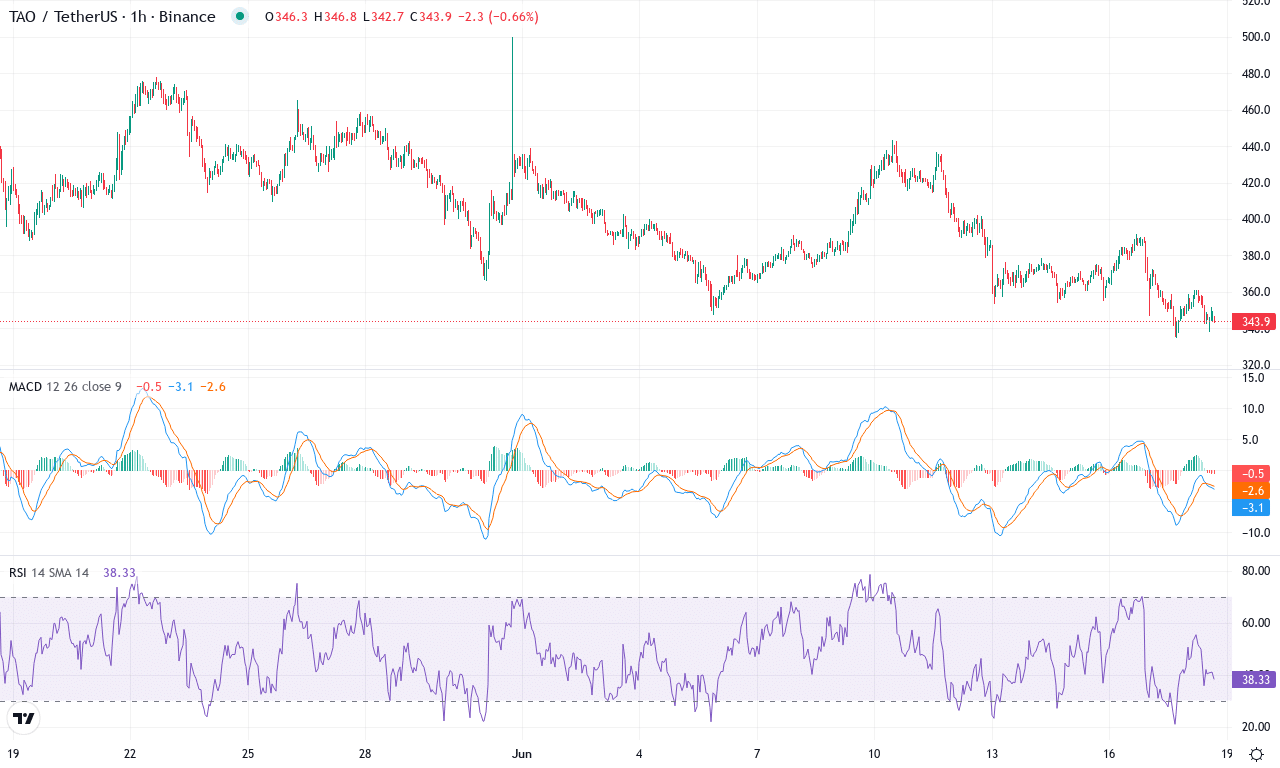
| Crypto | Close | 1W% | 1M% | RSI | ADX | MACD | CCI 20 | BITTENSOR(TAO) | $344.40 | -19.48% | -19.08% | 38.6 | 13.8 | -12.89 | -128.26 |
|---|
After a euphoric first quarter, Bittensor (TAO) has come under heavy fire, nosediving nearly 20% this month and showing no signs of recovery in the past week. The asset is currently pinned at $344.4, sitting just above its monthly lows after a punishing round of profit-taking and long liquidations. Despite a stellar 3-month run where gains topped 30%, the current selling pressure paints a starkly different picture. With TAO now trading well beneath its key short-term and intermediate moving averages, the technical outlook suggests that bullish momentum has faded for now, replaced by a sense of nervous stalling across high timeframes. As headwinds build, traders are left watching for signs of exhaustion from the bears or a potential spark that could reverse this bearish reversal.
Looking deeper, trend indicators show strong negative control—with the weekly momentum gauge rolling over and the MACD steadily diverging downward, reinforcing the case for continued downside. Oscillators flash further warnings: momentum and CCI readings have collapsed, and the RSI hovers in neutral-to-weak territory, suggesting that neither side has full conviction but sellers retain the upper hand. TAO sits well below a tangled web of moving averages, and any upside attempt will probably face stiff resistance around $383 and especially at $423, both of which coincide with significant prior reversal zones and psychological round numbers. If bulls manage to reclaim $383, we could see a quick rally toward $423; otherwise, I’m watching the pivotal $334–$345 region for a last line of support. A clean break lower would open the door to steep correction territory—brace for volatility if $334 fails. The market feels wary—don’t let emotions override your discipline at these inflection points.
Avalanche (AVAX) Price Analysis
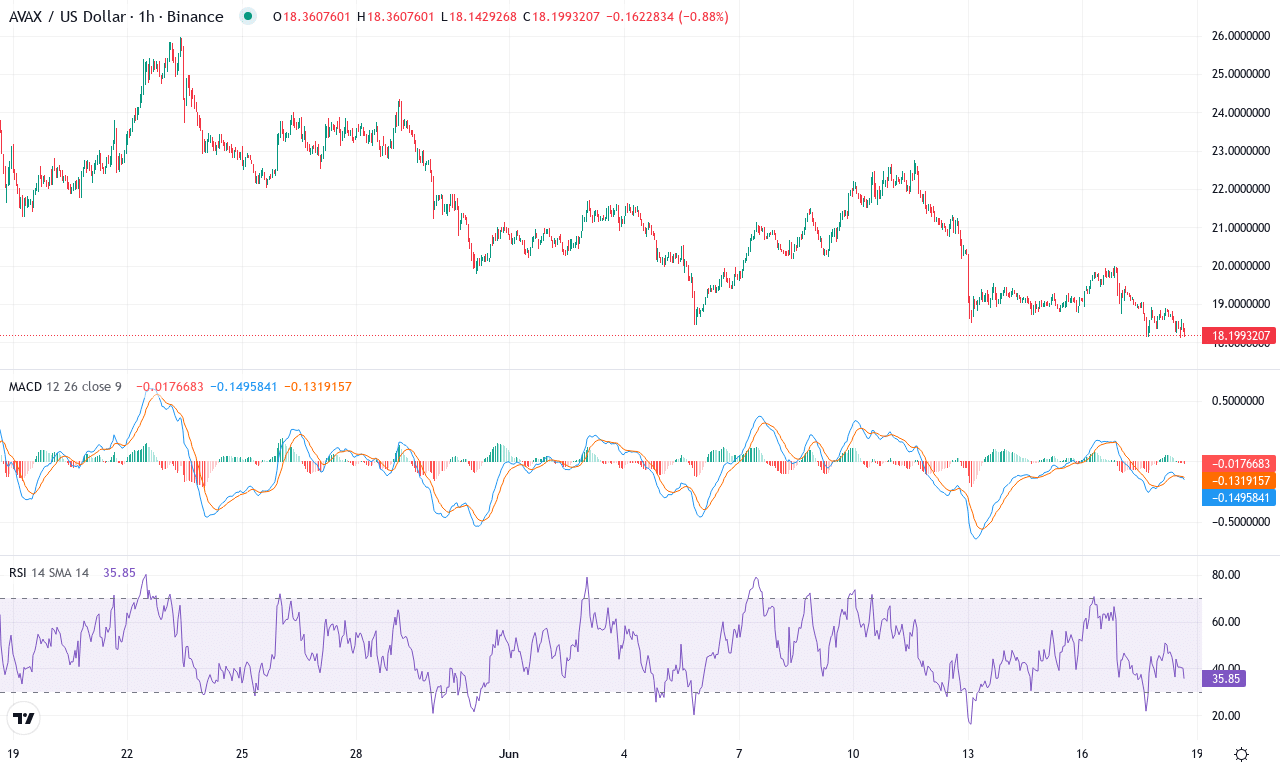
| Crypto | Close | 1W% | 1M% | RSI | ADX | MACD | CCI 20 | AVALANCHE(AVAX) | $18.14 | -19.60% | -21.41% | 35.7 | 16.8 | -0.88 | -132.12 |
|---|
After a punishing stretch that saw Avalanche tumble more than 21% this month and nearly 20% in the last week alone, the mood around AVAX has shifted from optimism to defense. The token’s year-long drop—down over 36%—highlights just how swiftly sentiment can swing when a challenging macro climate meets technical exhaustion. While AVAX trades near $18—barely above its monthly low—sellers have so far maintained control, with volatility swelling and the overall trend tipping aggressively lower. It’s an environment where risk looms large, but the stage is set for potential fireworks if support holds or capitulates. As a trader, I always respect both sides of these inflection points; nobody wants to be late when reversal momentum finally arrives.
Diving into the technicals, the avalanche of bearish momentum is undeniable. Trend indicators signal accelerating downside; Avalanche is trading well below its 10-, 20-, and 50-day exponential moving averages with moving average convergence/divergence deep in negative territory. The weekly MACD shows further deterioration, suggesting downside momentum is increasing rather than exhausting. Oscillators remain suppressed, with RSI and stochastic readings both signaling oversold conditions, but we’re not getting the classic bullish divergence that often flags imminent reversals—yet. Current price action clings to support near $18; if this floor gives way, risks of an extended fall toward the $15 psychological round number intensify. Conversely, any decisive bounce above $22 could squeeze shorts and set sights on the next resistance near $25. In my view, this is a textbook watch-and-wait scenario—oversold doesn’t mean bottomed, but if the bulls mount a comeback from these levels, it could be explosive. Stay nimble and ready; AVAX’s next move may catch the crowd off guard.
OKB (OKB) Price Analysis
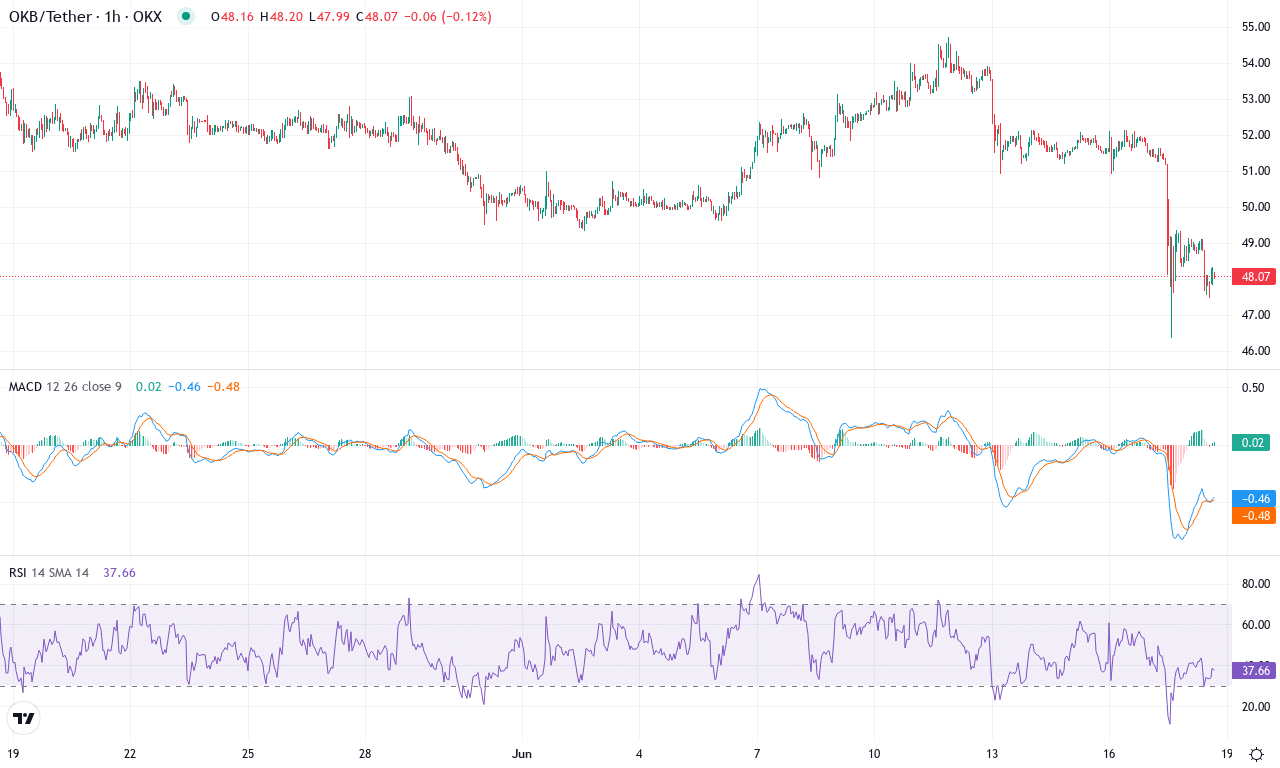
| Crypto | Close | 1W% | 1M% | RSI | ADX | MACD | CCI 20 | OKB(OKB) | $48.01 | -10.65% | -9.50% | 30.2 | 17.4 | -0.52 | -162.03 |
|---|
OKB has come under heavy fire this month, sliding nearly 10% and breaching previous support levels with little hesitation. After a sharp selloff pulled prices from the $54.72 monthly high down toward $48, the token’s one-week performance remained in the red, dragging sentiment lower. This sell-side pressure marks a distinct shift from OKB’s longer-term resilience, as the past three months saw only modest declines, with six- and twelve-month returns still in slightly positive territory. With OKB now hovering near the bottom of its monthly range, traders are watching closely for signs of a capitulation low—or a more profound correction if market nerves persist. When price unravels this quickly, I feel both cautious and alert; volatile reversals can surprise even seasoned traders.
The technical picture is decidedly bearish right now. Trend indicators have flipped negative: the directional index reveals that sellers have seized control of the trend, while the MACD remains deeply below its signal line—confirming lingering downside momentum. Weekly moving averages are now positioned above spot price, acting as resistance zones; OKB trades below every major moving average from 10 through 200 days, reinforcing a classic downtrend. Oscillators are flashing warnings, too; RSI has dipped below 30, often considered oversold, but other oscillators like the Commodity Channel Index and Williams %R underline ongoing bearish momentum. If bulls have any hope, they’ll need to reclaim the $52 pivot, where OKB’s next resistance cluster forms. If price can’t hold above $47, risks of an extended fall toward the $45 region are real. Right now, the onus is on buyers to defy gravity and restart a reversal, but let’s be honest—I wouldn’t be betting heavy on a sudden turnaround just yet.
Navigating the Inflection Point
TAO hovers at key support, highlighting the need for swift bullish action to avert further slips, while AVAX clings to its support, eyeing any potential for a rebound. Meanwhile, OKB’s movement remains watched as it tests critical resistances. These coins stand at a critical juncture, where upcoming reactions will dictate whether they can stabilize or if the bear grip intensifies. Traders should track momentum shifts and volume to anticipate the next directional move.