Solana, Chainlink, and Litecoin Traverse Bear Trenches as Key Support Zones Face Make-Or-Break Volatility
Solana, Chainlink, and Litecoin are currently navigating turbulent waters as they hover near critical support levels, with fluctuating market dynamics amplifying uncertainty. Solana’s 9% weekly retreat, after reaching highs near $188, signals a potential waning of its recent bullish momentum, now facing the formidable $136 support mark. Chainlink, bleeding over 10% this past week, finds itself on the brink, inching closer to a pivotal $12.65 support zone, amid persistent selling pressure. As Litecoin grapples with a substantial 35% six-month drawdown, it stands precariously at $85, with bearish momentum showing little sign of immediate reversal. Will these cryptocurrencies find support and rebound, or are they poised for further capitulation? Let’s break down the technical setup across the board.
Solana (SOL) Analysis
| Crypto | Close | 1W% | 1M% | RSI | ADX | MACD | CCI 20 |
|---|---|---|---|---|---|---|---|
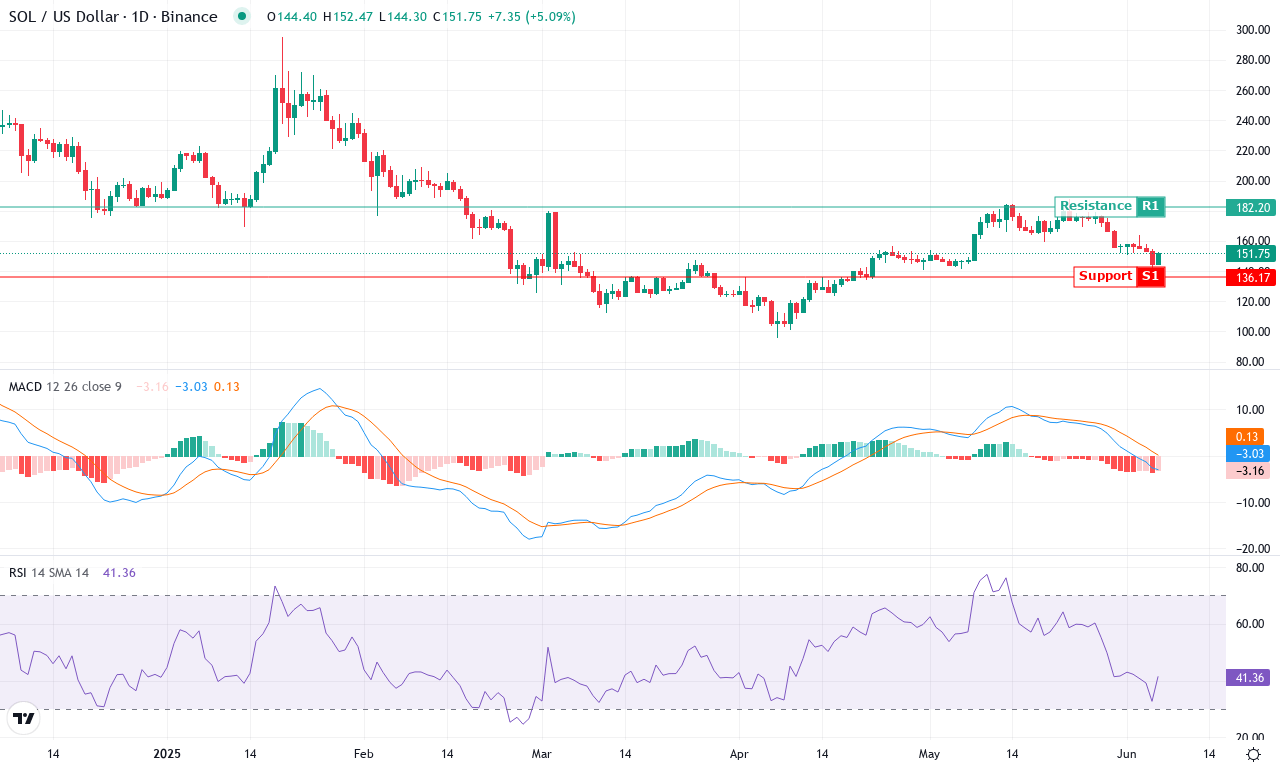
| SOLANA (SOL) | $151.92 | -8.89% | 3.38% | 41.6 | 23.2 | -3.02 | -119.61 |
After a robust climb to monthly highs near $188, Solana has cooled off, retreating by 9% this past week and now consolidating around $151. This mild pullback comes after a resilient multi-month run that saw Solana outperform many peers, despite a harsh 36% six-month correction still weighing on the broader macro picture. While June’s modest monthly gain of just over 3% suggests underlying bulls remain active, fading momentum in recent days warns traders to approach with caution. I have to admit, seeing Solana rebound from the $140 zone was promising—yet pressure’s mounting as volatility surges and the market grapples with directional uncertainty. The high monthly wick hints at profit-taking, a sign institutions may be cooling their appetite for aggressive buys at these levels.
Technically, trend indicators show Solana at a crossroads. While the average directional index remains elevated—signaling a strong underlying trend—the negative directional movement has overtaken the positive, and the MACD lines are flipping bearish after a week of sluggish price action. Short-term oscillators and the RSI, hovering near the low 40s, reveal a loss of bullish momentum and no clear sign of oversold conditions just yet. Solana trades slightly below its key short-term moving averages, but remains above the $136 support—an area to watch closely if sellers intensify. To reclaim upside momentum, bulls must break decisively above resistance near $182 and put an end to this choppy range. If Solana falters and breaks down through $136, risks mount for an extended fall, possibly dragging the price as low as $115 before finding firmer footing. I’m watching these levels with intensity; a clear move in either direction could set the tone for Solana’s next decisive trend.
Chainlink (LINK) Analysis
| Crypto | Close | 1W% | 1M% | RSI | ADX | MACD | CCI 20 |
|---|---|---|---|---|---|---|---|
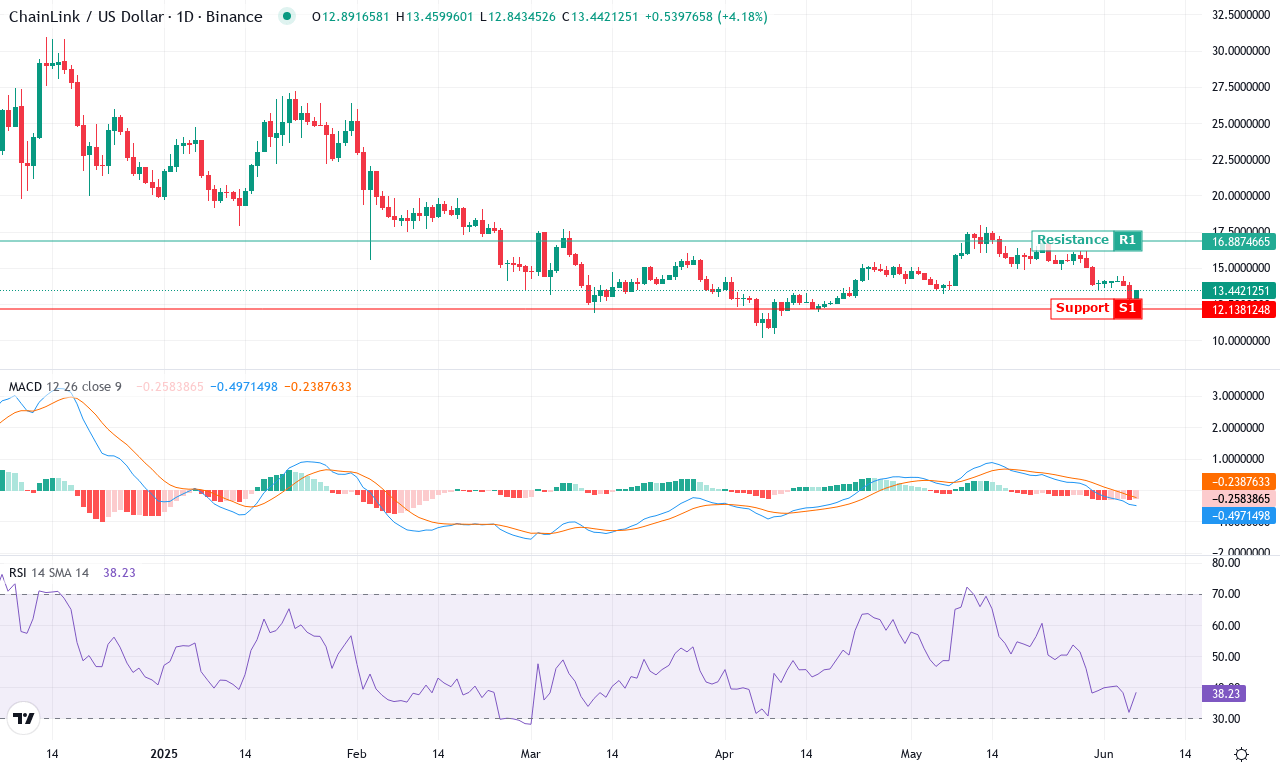
| CHAINLINK (LINK) | $13.45 | -10.53% | -2.77% | 38.3 | 22.1 | -0.50 | -125.15 |
After a tumultuous month marked by steep declines, Chainlink finds itself at a crossroads. LINK dropped over 10% this past week alone and continues to slide, posting a negative monthly performance just shy of -3%. The ongoing drawdown has erased nearly half its value in six months—an undeniably painful move for trend followers and long-term holders alike. Yet, as the dust settles near $13.40, the price is approaching a major inflection zone, sandwiched between the monthly low and a previous support level. The broader technical outlook is clouded: while sellers have dominated, the sheer depth of recent losses suggests the potential for high-volatility mean-reversion. If there’s a rebound coming, it may be swift and dramatic—something I’m watching for closely as traders reposition.
Diving into the technicals, trend indicators continue to flash caution—trend strength remains elevated, yet negative directional readings outweigh the positive. The MACD shows persistent bearish momentum, with both the main line and signal beneath their zero marks and no sign of a bullish crossover yet, pointing to unresolved downside pressure. Oscillators echo the gloom: major momentum gauges and CCI readings remain deeply negative, and RSI hovers in the mid-thirties, skirting oversold territory but not quite triggering panic lows. Price now sits well below all major moving averages, highlighting a market adrift in bearish momentum. Key support sits around $12.65; if bulls fail to defend this region, risks extend toward $10. Major resistance looms at $15, which also aligns with a battleground of prior moving average levels—a decisive close above could spur short-covering rallies up to $16.90 or even $18. For now, the bears still hold the reins, but as we’ve seen before, prolonged selling can breed conditions ripe for explosive reversals. Stay nimble—inflection points like this can blindside both sides.
Litecoin (LTC) Analysis
| Crypto | Close | 1W% | 1M% | RSI | ADX | MACD | CCI 20 |
|---|---|---|---|---|---|---|---|
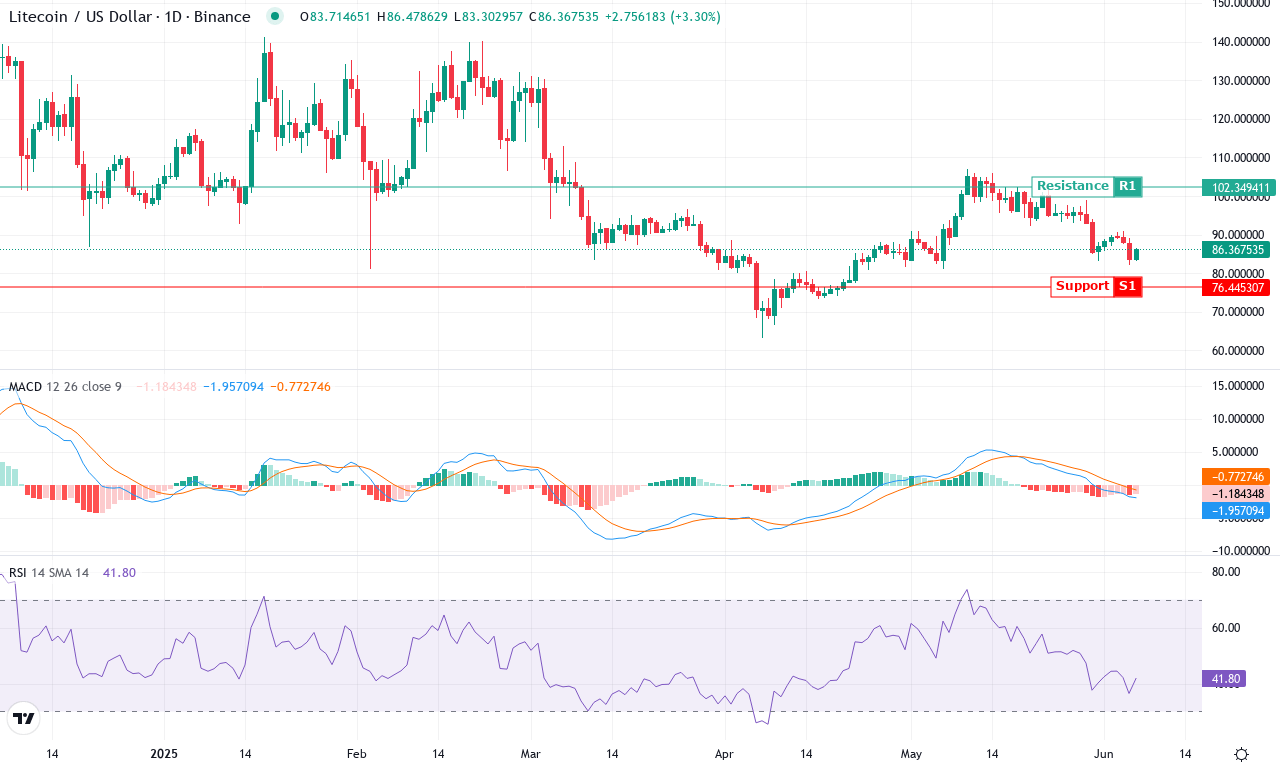
| LITECOIN (LTC) | $86.50 | -7.32% | -5.66% | 41.9 | 18.2 | -1.94 | -113.56 |
After a bruising month punctuated by sharp declines, Litecoin is trading with a defensive posture, having shed nearly 6% over the past month and facing a punishing 35% drawdown over six months. The latest weekly action only deepens the anxiety, with LTC tumbling nearly 8% and underperforming broader market moves. Market structure is weighed down by relentless sell pressure, yet price action hovers near the psychologically significant $85 zone—a region where the coin previously carved out a local low earlier in the year. With most moving averages stacked overhead and momentum tailwinds fading, the technical outlook suggests low conviction among bulls. Litecoin finds itself battling existential drift; unless it can snap this negative feedback loop, risks of a further slide remain uncomfortably high. I’m frankly unsettled by this persistent weakness—defensive plays might be prudent until the market telegraphs a reversal.
Technically, trend indicators continue to signal a precarious landscape: the ADX remains well above trending thresholds, but with the negative component entrenched above the positive, bearish momentum dominates. Anyone hoping for a mean-reversion bounce needs stronger evidence—MACD lines are buried beneath the signal, histogram remains negative, and oscillators show little appetite for upward reversal. RSI languishes in neutral territory after overbought relief several months ago, and oscillators like the Commodity Channel Index signal persistent downside momentum. Price is stuck beneath all key exponential moving averages, while even short-term pivots are acting as stubborn resistance. Immediate support sits at $82, but a break below this level could trigger a steep correction toward the $76 area. Conversely, should bulls muster a surprise move and reclaim the $92–$95 region, a swift relief rally could ensue, targeting $102 and then $117. For now, a heavy-handed bearish reversal looms—I’ll be watching for signs of capitulation or a catalytic spark to revive LTC’s fortunes. Buckle up.
Awaiting Resolution: Will Support Zones Hold?
Solana, teetering at $136 support, must regain strength soon to avoid deeper declines. Chainlink’s trajectory near $12.65 support remains uncertain, as selling pressure could dictate its next move. Litecoin struggles at $85, with its bearish trajectory still unchallenged. As these critical levels are tested, traders are poised to react, with the next moves likely guiding short-term direction.