BNB, Solana, and XRP Tread Water Near Key Supports As Volatility Builds—Which Coin Blinks First
BNB, Solana, and XRP have navigated turbulent waters, each hovering near key support zones as market dynamics shift and volatility lurks. Recent price movements suggest a brewing contest between bulls and bears, with BNB witnessing a modest 1% dip, Solana retreating 12% from its recent highs, and XRP shedding nearly 8% over the month. At these psychological levels, the tension mounts: will buyers stage a robust comeback, or could we see a sharper correction unfold? Let’s take a closer look at the signals behind the move.
BNB (BNB) Price Analysis
| Crypto | Close | 1W% | 1M% | RSI | ADX | MACD | CCI 20 | BNB(BNB) | $648.40 | -0.93% | -0.25% | 47.3 | 16.2 | -1.77 | -62.76 |
|---|
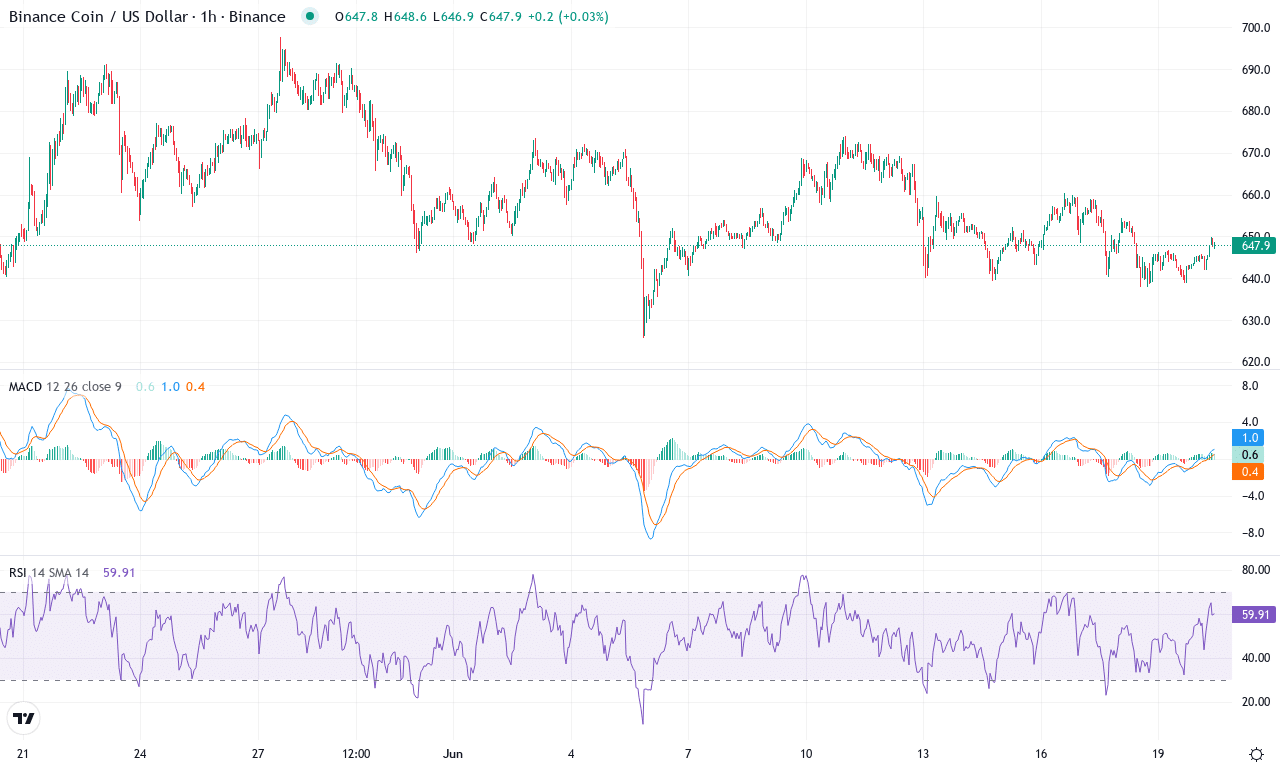
After an impressive rally earlier this quarter, BNB has entered a phase of consolidation near $650, testing trader patience with subtle swings between its monthly high of $697 and a low of $625. The coin has essentially stagnated over the past week, reflecting a minor dip of almost 1%—hardly inspiring, but telling of an indecisive market. On a monthly horizon, price action remains muted, pushing BNB closer to key support around $646, which is anchored by both the 50-day exponential moving average and the classic pivot midpoint. A hesitant sentiment lingers, as short-term holders weigh profit booking against the potential for a resurgence. The technical outlook suggests volatility may be lurking just under the surface—after all, sideways markets rarely last forever, and BNB’s track record has taught me to brace for fireworks when least expected.
Diving into the technicals, trend indicators remain elevated, but there are signs the bulls are struggling to recapture momentum. The directional index shows a persistent tug-of-war, with no clear winner. The weekly MACD has started to flatten out after weeks of strength, cautioning against blind optimism. While BNB still trades above most longer-term moving averages—a constructive signal—momentum oscillators appear conflicted: RSI hovers in the mid-50s, suggesting neither overbought nor oversold territory, while the Stochastic indicators flash mixed signals, hinting at potential consolidation. If buyers can reclaim the psychological $700 barrier, the next stop could be the monthly high or even an attempt on $760. Conversely, a breakdown below the $645 support would risk a steeper correction to the $596 level, marking a shift towards bearish momentum. As BNB teeters on this edge, all eyes are on the next decisive move; for now, patience remains a trader’s best ally.
Solana (SOL) Price Analysis
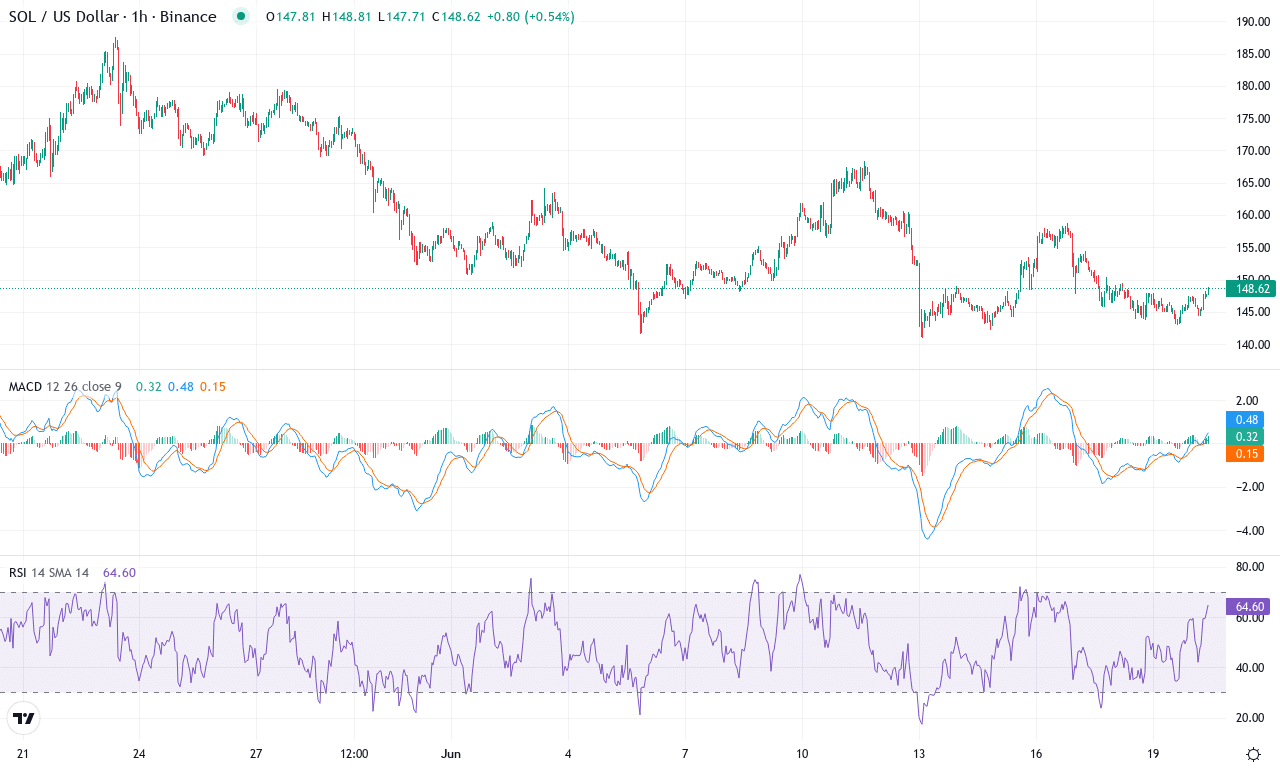
| Crypto | Close | 1W% | 1M% | RSI | ADX | MACD | CCI 20 | SOLANA(SOL) | $148.71 | -2.33% | -11.80% | 43.9 | 15.9 | -3.67 | -73.05 |
|---|
Solana has come under notable pressure after a period of impressive gains, with the token dipping nearly 12% over the month and hovering close to $149—a drop from its recent high near $188. This sharp retracement has triggered a wave of concern among traders who watched bullish momentum erode, especially after Solana’s sensational 15% three-month rally. The technical backdrop is shifting: after a lengthy bullish run and strong institutional inflows earlier this quarter, the price action is now testing the nerves of bulls and inviting opportunistic bears. As volatility surges and profit-booking ramps up, the community is split—will SOL reclaim momentum, or is a steeper correction in store?
Zooming into the chart, trend indicators are signaling a loss of bullish dominance. The underlying trend remains moderately strong, but with negative momentum swelling and the weekly MACD showing further acceleration to the downside, it’s clear that sellers are regaining some control. RSI has slipped toward neutral territory, suggesting exhaustion but not full capitulation, while oscillators flash caution as short-term momentum fades. Solana now trades just below all its short-term moving averages, reinforcing the view that bullish momentum is waning for now. Immediate support is clustered near $137—a decisive level that, if breached, could open the gates to a steeper drop toward psychological support around $116. That said, if bulls muster a sharp recovery and force a close back above $161 (the recent key pivot), I’d expect fresh bids and a push toward resistance at $182. This is a pivotal moment: either bears drive a deeper pullback, or Solana shakes out weak hands and squeezes higher once more. Eyes on the next move—it could set the tone for the summer’s action.
XRP (XRP) Price Analysis
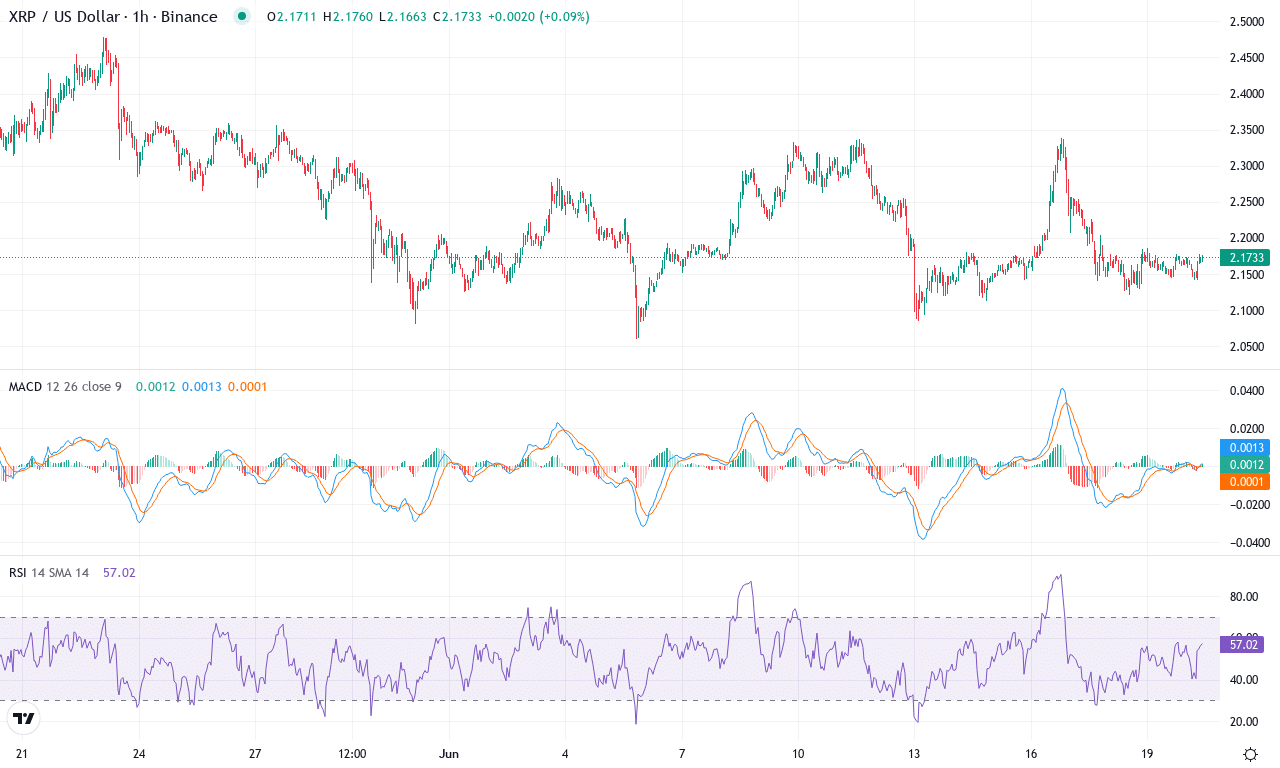
| Crypto | Close | 1W% | 1M% | RSI | ADX | MACD | CCI 20 | XRP(XRP) | $2.17 | -0.78% | -7.82% | 45.8 | 12.9 | -0.03 | -49.30 |
|---|
After a brutal month that shaved nearly 8% off its value, XRP is stuck in a limbo between bullish hope and mounting doubt. The last week hasn’t offered any solace either, with XRP grinding slightly lower while volatility cools. Despite its remarkable long-term rally—still up more than 340% over the past year—XRP’s technical outlook suggests bulls are taking a breather. Price is nestled just above $2.17, showing respect to the prior monthly low near $2.06, but remains vulnerable to a steeper correction should sellers gain momentum. If you’re like me, you’re watching with a mix of anticipation and anxiety, knowing that XRP is coiling near a crucial inflection point where breakout momentum or risks of an extended fall could both materialize quickly.
Digging into the technicals, XRP’s trend indicators reflect waning bullish momentum but also a lack of strong bearish conviction. The ADX is modest, implying a tepid trend, while movement indicators show buying and selling pressures are nearly balanced—a classic recipe for choppy price action. The weekly MACD, which was perking up last week, has now flattened, erasing hints of bullish acceleration, and oscillators echo this indecisiveness: RSI sits in neutral territory, CCI has swung deep negative, and short-term momentum has fizzled. Price is hovering near the 10-day EMA and clinging to moving average support, but a decisive close below the key $2.06 support zone could usher in swift downside toward the next psychological level at $1.95. On the upside, if bulls reclaim resistance near $2.25, that could reignite upside interest and put $2.53 back in play. For now, XRP is at the crossroads—get ready for fireworks if either side seizes control.
Which Way Will the Market Turn?
BNB clings to support just above $300, while Solana tests its resolve near $100, and XRP hovers around $0.50. If buyers don’t step in, these levels could begin to yield to bearish pressures. Traders are poised for the next decisive move, as each neckline brims with potential and volatility keeps the stage alive.