HYPE And SPX6900 Bulls Defend Highs As Relentless Momentum Fights Looming Exhaustion
Hyperliquid (HYPE) has dazzled the crypto space with a 38% surge this month, leaving traders abuzz. Meanwhile, as HYPE approaches psychological barriers, the question arises: Can the bulls maintain their grip or will momentum falter? With crucial resistance zones looming, the stage is set for a potential showdown. Let’s break down the technical setup across the board.
Hyperliquid (HYPE) Price Analysis
| Crypto | Close | 1W% | 1M% | RSI | ADX | MACD | CCI 20 | HYPERLIQUID(HYPE) | $36.82 | -9.09% | 38.89% | 50.9 | 35.2 | 2.04 | -30.85 |
|---|
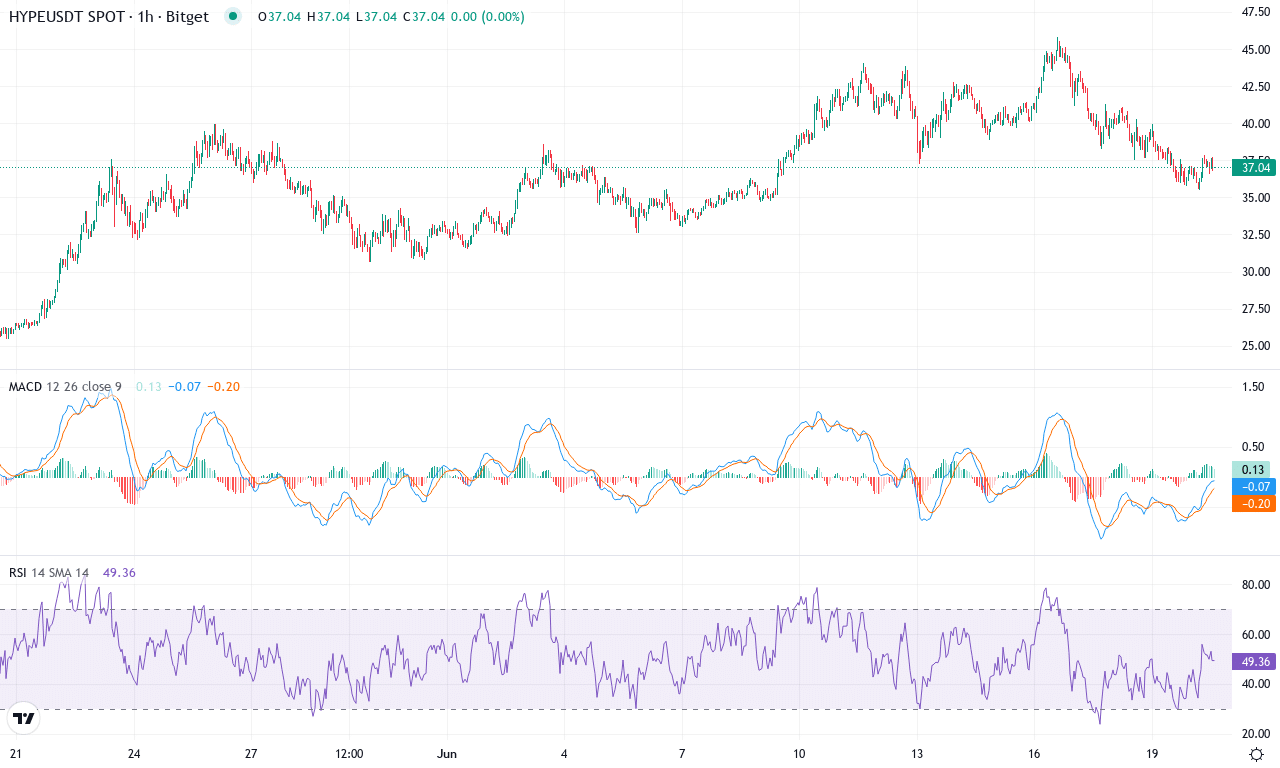
After an explosive run that saw Hyperliquid (HYPE) surge over 38% this month and notch an astonishing 131% gain in three months, the token is now taking a breather. Last week, price action cooled off with a 9% pullback, bringing HYPE down from monthly highs above $45 to close near $36.80. Despite this short-term cooldown, the macro trend remains decisively bullish—annual returns in excess of 1300% tell you institutional inflows and speculative fervor are still in play. The story here is pure momentum: HYPE has emerged from relative obscurity and is now dancing around its former all-time highs, riding waves of volatility that reward the nimble and punish the complacent. If you’re a trend follower at heart, this is what you wait all year for.
Under the hood, technical indicators paint a battlefield marked by bullish momentum with faint undertones of exhaustion. The Average Directional Index reads robust trend strength, while trend indicators and the MACD both point higher—though the MACD itself hints at deceleration relative to last week. Oscillators like RSI hover in elevated territory but haven’t quite screamed “overbought” yet, suggesting room for further rallies as long as buyers defend key zones. HYPE sits comfortably above every major moving average, with short-term EMAs tightly clustered below price, reinforcing support in the $32–$34 range. Immediate resistance looms overhead near $42; if bulls can recapture that, a fresh breakout toward $46 and beyond becomes likely. But—if profit-taking accelerates or sentiment sours, HYPE risks a steep correction down toward the $30 level, where psychological support and the 50-day EMA should attract dip buyers. Personally, I’m on edge here: the stakes are high, momentum is surging, and any decisive move should set the tone for weeks to come. Strap in—volatility is far from over.
SPX6900 (SPX) Price Analysis
| Crypto | Close | 1W% | 1M% | RSI | ADX | MACD | CCI 20 | SPX6900(SPX) | $1.32 | -16.50% | 78.45% | 53.8 | 44.8 | 0.12 | -3.33 |
|---|
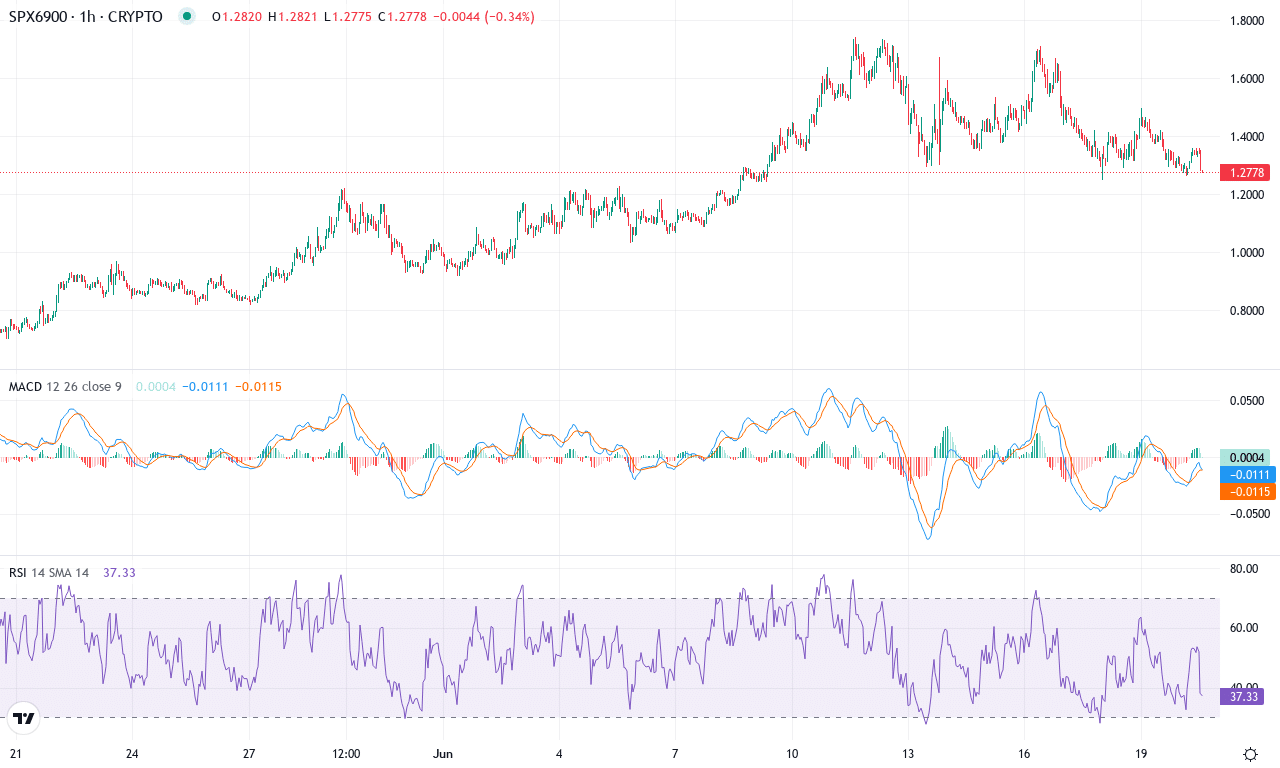
After months of relentless ascent, SPX6900 has taken a dramatic leap, surging over 78% this month and notching an extraordinary 1658% gain in the past year. This breakneck rally has propelled the coin well above its recent consolidation range, with price pushing past the psychological $1 mark to close near $1.32. Such explosive upside is rare in any asset class—momentum traders are surely riding high, while others may be nervously eyeing the vertical climb for signs of exhaustion. As SPX6900 carves out new highs, the narrative is shifting from mere survival to aggressive profit capture and caution against sharp reversals; it’s a market where fortunes can flip in a heartbeat.
Technical signals amplify the buzz. Trend indicators confirm strong bullish control—ADX sits comfortably above trend-confirmation territory, and positive directional movement dwarfs its negative counterpart, underlining robust underlying momentum. The MACD line continues to rise above its signal on both weekly and daily timeframes, suggesting a steady swell of upward conviction. Oscillators, including the ultimate oscillator and RSI, hover at elevated—but not yet overbought—territory, hinting that while bulls retain control, the coin is approaching levels where profit-taking surges could ignite higher volatility. Price remains solidly above all major moving averages, with $1.00 now likely to act as a vital support. Immediate resistance looms near $1.65, with $1.75 as the next hurdle if bulls keep pressing. If there’s any sustained dip below $1.28, watch for buyers to step in aggressively; however, be wary—should the rally fizzle, risks of a steep correction grow. As a trader here, I’m exhilarated by the sheer velocity—just don’t lose sight of the exit in this kind of vertical market.
Can HYPE Momentum Sustain?
HYPE hovers near critical resistance, testing its bullish fervor, while SPX6900 bulls strive to secure their newly reached highs. A breach above these levels could ignite further rallies, but waning momentum might trigger a pullback towards support. Traders await the next session’s decisive moves, with cautious optimism and eyes on the volume to validate any breakout.