Solana And Cardano Teeter At Pivotal Support As Bears Threaten Deeper Collapse
Solana and Cardano find themselves at a precarious juncture after both enduring sharp declines amid wider market volatility. Solana’s recent slump near the $130 support zone challenges its short-term bullish hopes, while Cardano teeters around $0.56, with sentiment soured following a dramatic pullback. As these assets approach critical inflection points, one question looms large: will buyers muster the strength to defend these levels, or are we on the brink of deeper declines? Let’s break down the technical setup across the board.
Solana (SOL) Price Analysis

| Crypto | Close | 1W% | 1M% | RSI | ADX | MACD | CCI 20 | SOLANA(SOL) | $140.28 | -5.62% | -19.18% | 37.1 | 17.4 | -4.75 | -140.51 |
|---|
Solana is coming off a bruising month, shedding nearly 20% and underperforming heavily after a roller-coaster first half of 2024. The token has lost its footing at the high end, sliding from a monthly peak near $188 to close at $140, as risk appetite among traders has clearly cooled. A short-term bounce last quarter gave way to fresh selling pressure, and if I’m honest, it feels like bulls are once again on the back foot. The recent weekly performance—down another 5%—compounds the mood, pushing Solana dangerously close to a critical support zone in the low $130s. With the macro backdrop offering little relief, the technical outlook suggests Solana is at a make-or-break crossroads: one strong downside move could open the door to a steep correction, while stabilization here could provide a platform for revival.
Digging into the details, the trend indicators show that the directional bias is slipping: Solana’s trend strength remains high, but growing negative divergence signals that bearish momentum is taking hold. The weekly MACD is accelerating downward, and oscillators, including the RSI which has retreated well below any exuberant threshold, imply the market has lost its bullish steam. Price is now trading just above the key moving averages clustered around $137–$157, with the nearby $135–$140 band acting as pivotal support. Overhead, $160 stands out as looming resistance—if bulls can regroup above this level, a rally back toward $182 comes into play. But if price slips decisively under current support, risks of an extended fall toward the $116 zone mount quickly. I’m watching this inflection point closely: sellers are getting bold, and unless buyers reappear with conviction, downside volatility could accelerate in dramatic fashion.
Cardano (ADA) Price Analysis
| Crypto | Close | 1W% | 1M% | RSI | ADX | MACD | CCI 20 | CARDANO(ADA) | $0.59 | -8.88% | -24.03% | 32.1 | 21.4 | -0.03 | -138.02 |
|---|
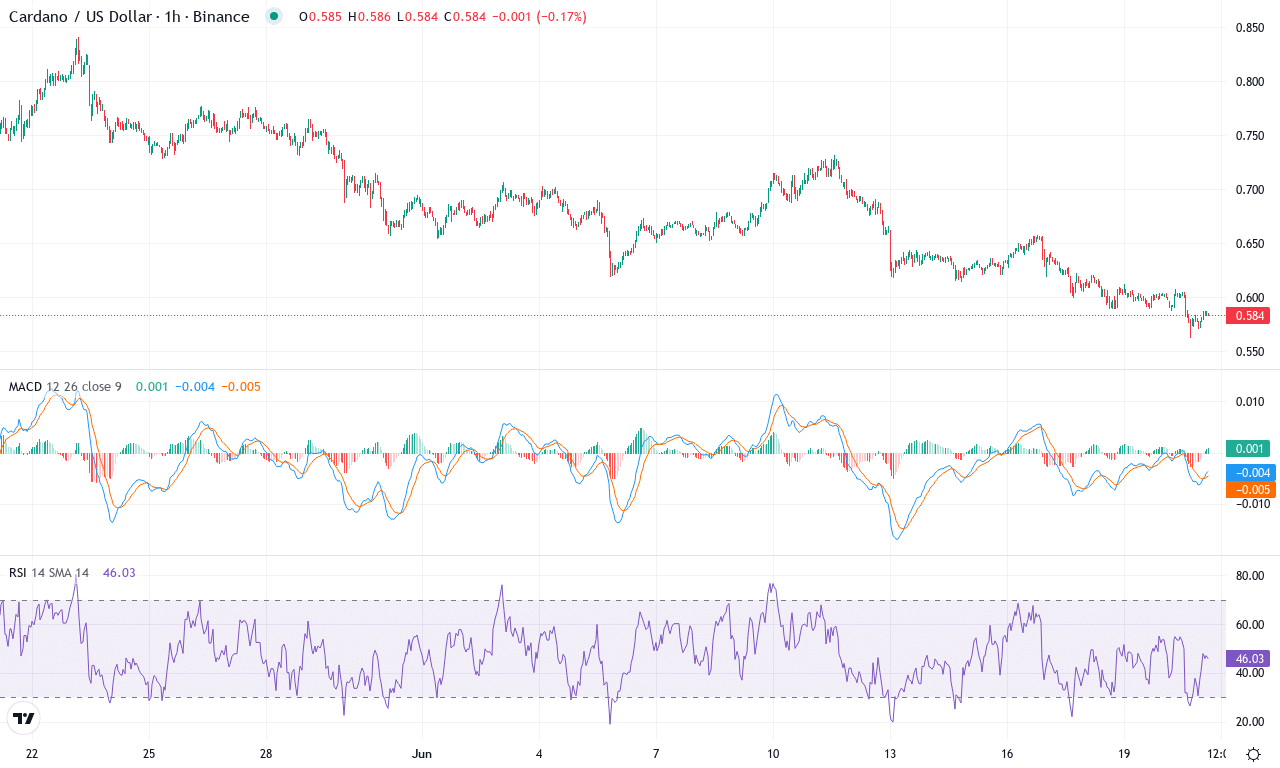
Cardano has taken traders on a wild ride this month, plunging over 24% in a sharp correction after peaking near $0.84 and then cascading down to $0.56. Despite a solid 52% gain over the past year, the past week’s nearly 9% slide signals that bullish momentum has hit a wall, leaving ADA languishing at $0.585—a stone’s throw from its monthly low. These are the moments that test conviction: after a brutal three-month drop and clear underperformance versus the broader market, risk appetite is fading as buyers get squeezed and the bears take the driver’s seat. Yet, for the patient, these deep drawdowns often plant the seeds of the next major swing.
Digging into the technicals, Cardano’s trend indicators suggest a decisive loss of bullish control, with elevated trend strength reinforcing the current bearish momentum. The weekly MACD has dipped into negative territory—matching the direction of a retreating Awesome Oscillator and declining momentum gauges—while the RSI continues to fall, hinting that further downside isn’t off the table. Price action is now clinging to support just above $0.56, alarmingly close to key breakdown levels. Watch closely: if sellers punch through this zone, risks of an extended fall toward the psychological $0.50 mark become real, with next support in the low $0.40s. However, should bulls fend off the onslaught and reclaim ground above the $0.65–$0.68 cluster (notably around the 20- and 50-EMAs), a short-term bounce could ignite, targeting resistance near $0.73 and possibly $0.84. At this inflection point, the technical outlook suggests heightened volatility ahead—I’ve got my eye on the breakout levels, but I’d be cautious until momentum proves itself. Remember, the pain of drawdown often precedes the thrill of reversal.
Will Support Zones Hold?
Solana remains under pressure near $130, where a break could lead to further bearish moves, while Cardano hovers around $0.56, testing buyer resilience at this crucial support. A successful defense here could signal consolidation or recovery, but failing to hold might accelerate the downtrend. Investors are closely watching buyer activity and market response to gauge the next directional shift.