Aave, Bitcoin Cash, HYPE, and Compound Bulls Eye Breakouts as Overheated Signals Flash Caution
In the face of heated crypto markets, Aave and Bitcoin Cash are clawing their way back to the spotlight with notable monthly surges, while HYPE and Compound rally with explosive intensity. With Aave’s technical indicators flirting with overbought zones and Bitcoin Cash testing crucial resistance levels, the stage is set for potential dramatic moves. Traders eye these signals with trepidation: could this momentum be the dawn of a sustained breakout or a harbinger of profit-taking reversals? Let’s break down what the indicators reveal.
Aave (AAVE) Price Analysis
| Crypto | Close | 1W% | 1M% | RSI | ADX | MACD | CCI 20 |
|---|---|---|---|---|---|---|---|
| AAVE(AAVE) | $278.23 | 9.60% | 20.59% | 56.6 | 26.4 | 12.97 | 40.05 |
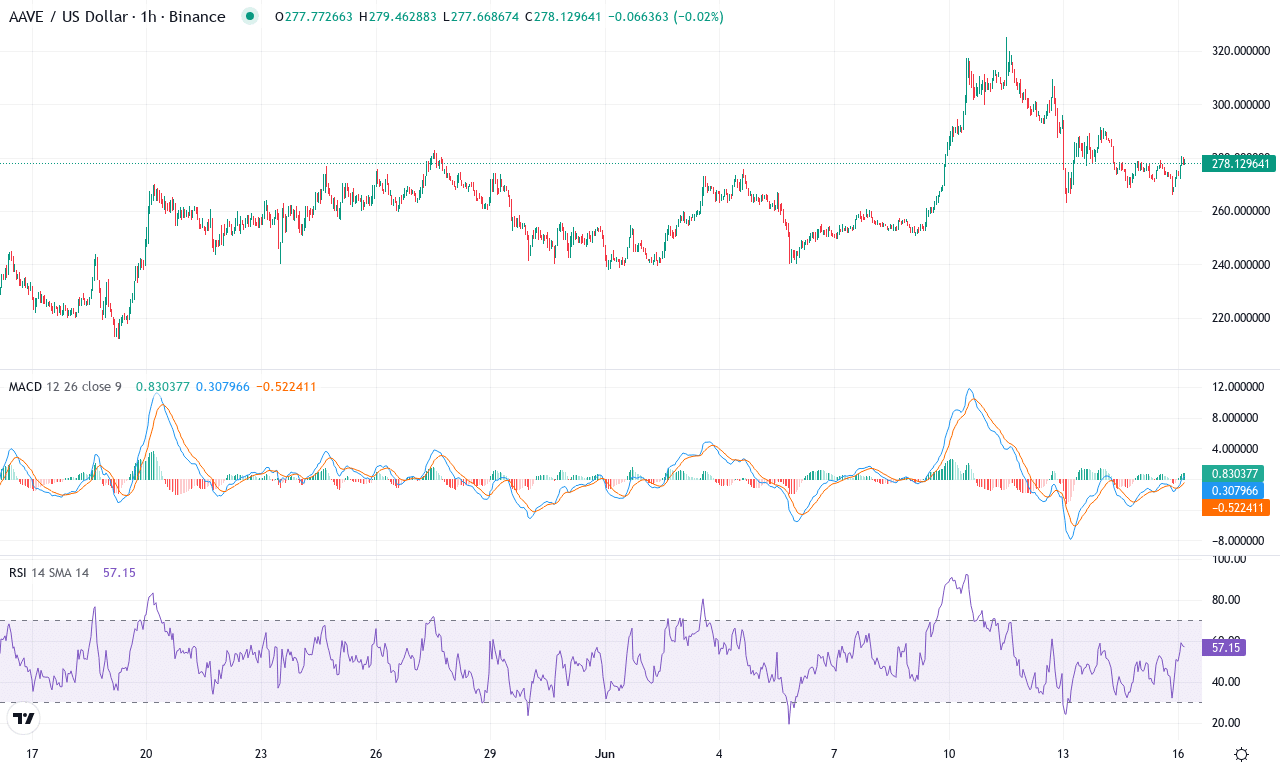
After a robust 20% monthly rally, Aave has snapped back into focus, breaking north of $270 and charging toward its recent peak at $325. Sentiment in the Aave camp has shifted considerably in the past week, as price action carved out a nearly 10% advance and bulls regained lost ground from the spring correction. Last quarter’s momentum was nothing short of explosive, but the six-month chart reminds us how quickly tides can turn—AAVE is still underwater versus its December highs. With volatility swelling and trend indicators trending solidly higher, traders sense that further upside could be on tap. Personally, any sustained push past $300 would set alarms blaring for a fresh leg up—this is one I don’t want to miss.
Diving into the technicals, Aave’s trend strength is pronounced: the average directional index remains firm, and positive directional momentum is comfortably outpacing selling pressure. Weekly MACD continues to accelerate upward, while the daily MACD and oscillators are echoing newfound bullishness. Multiple fast-moving averages are stacking above slower counterparts, underscoring a regime change toward buyers—notably, price is also holding steady above all key exponential moving averages, which should embolden the bulls. However, with RSI ticking into the low 60s and stochastic signals staying elevated, AAVE flirts with overbought territory—a red flag for an abrupt spike in profit taking or long liquidations if euphoria overruns discipline. If bulls clear $325 with conviction, technical outlook suggests the next big magnet sits near $350, aligning with this month’s upper pivot band. Should sellers regain control, watch for swift pullbacks to $240 or even $225 support—the last places I’d want to see bulls throw in the towel. Stay nimble; this chart is one to trade, not to marry.
Bitcoin Cash (BCH) Price Analysis
| Crypto | Close | 1W% | 1M% | RSI | ADX | MACD | CCI 20 |
|---|---|---|---|---|---|---|---|
| BITCOIN CASH(BCH) | $454.12 | 10.29% | 14.64% | 61.3 | 19.7 | 12.68 | 167.63 |
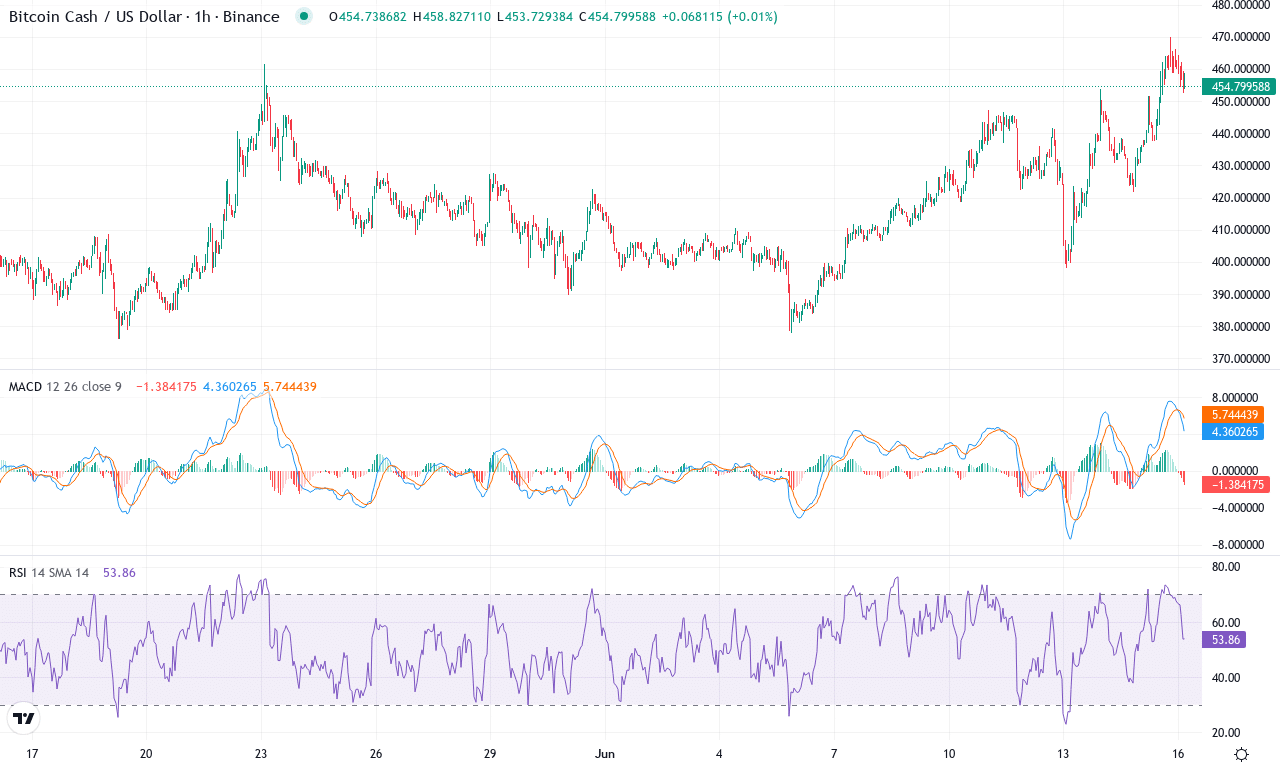
After a month of strong gains and a 10% weekly surge, Bitcoin Cash (BCH) is reasserting itself as one of the market’s standout performers. The asset has punched through its short-term resistance to close near $454, just shy of this month’s high around $470. Notably, BCH bucked the recent trend of sluggish large-cap moves, notching an impressive 14% rally in the past month and over 34% in the last quarter. While prior six-month losses still cast some shadow, this sharp rebound suggests bulls are regaining control. I love seeing this kind of forceful bounce—it signals that despite broad uncertainty, traders haven’t lost their appetite for aggressive upside.
Diving into the technicals, the trend indicators are unambiguous: momentum is swelling and the rally could have further room to run. The ADX shows a robust uptrend, while a sharply accelerating MACD supports the narrative of strengthening bullish momentum. Oscillators such as RSI and CCI are nearing overbought territory, but haven’t flashed a sell signal yet—always a sign worth monitoring, as it can foreshadow profit-taking surges. Price action remains firmly above the key short-term moving averages, and BCH is currently consolidating above the pivotal $440–$450 region. Immediate resistance lurks in the $470–$480 zone; a clean break could trigger a push toward the psychologically significant $500 mark. Conversely, if sellers step in and drive a correction, look for strong support to be tested near $420, with a steeper correction exposing the $400 level. I’m watching for a fresh breakout—if bulls clear $480, all signs point to BCH targeting new local highs. The mood here is tense, but with so many signals converging, upside risk looks hard to ignore.
Hyperliquid (HYPE) Price Analysis
| Crypto | Close | 1W% | 1M% | RSI | ADX | MACD | CCI 20 |
|---|---|---|---|---|---|---|---|
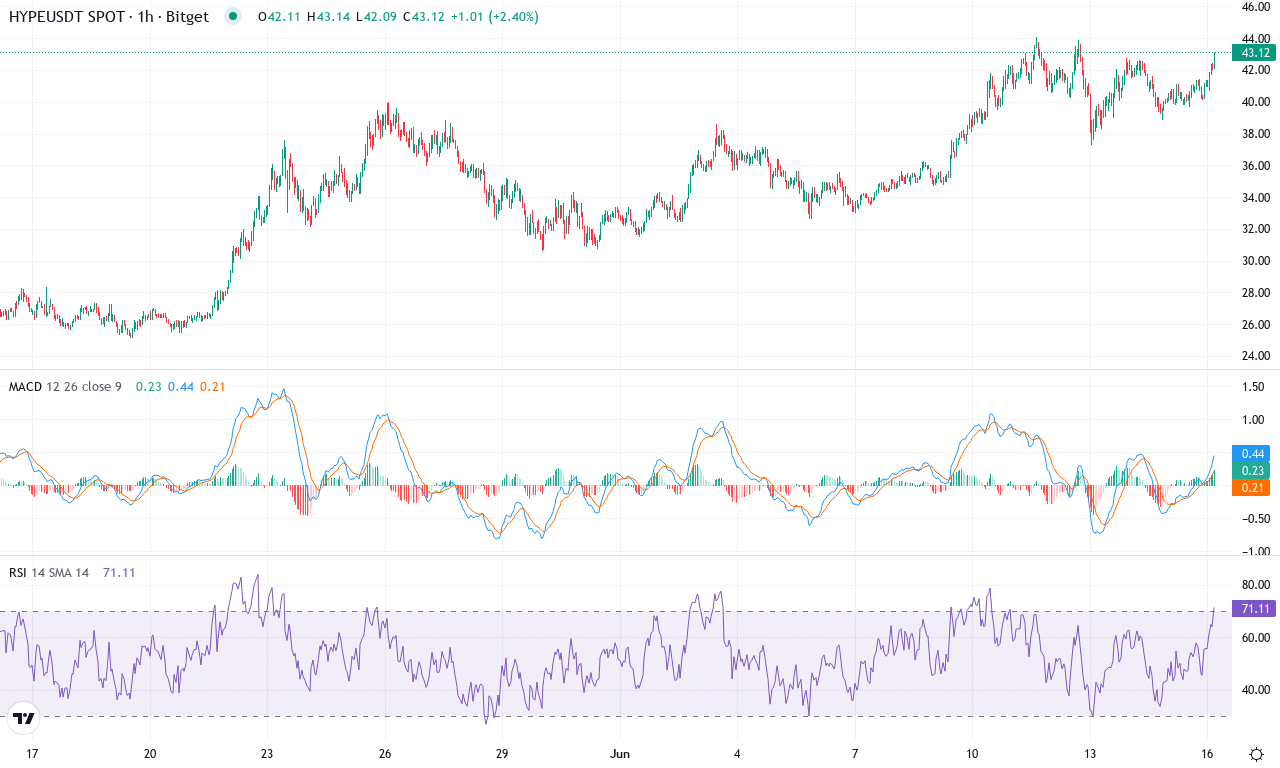
| HYPERLIQUID(HYPE) | $43.00 | 23.00% | 60.39% | 67.7 | 40.4 | 3.32 | 113.79 |
After a thunderous rally that’s caught even seasoned traders off guard, Hyperliquid (HYPE) is grabbing center stage with an explosive move—up over 60% this month and a staggering 1,620% over six months! Most altcoins can only dream of this kind of vertical price action. As HYPE surges to new monthly highs near $44, the bulls are firmly in control, breaking out from a long consolidation and leaving skeptics in the dust. Momentum is unmistakably swelling, and with buyers stepping in on every dip, the technical outlook suggests potential for further gains—though at these heights, volatility surges and sudden profit-taking can create whiplash swings. With sentiment feeding off this parabolic move, I can’t help but feel a twinge of excitement (and caution) as price presses against uncharted resistance levels and fresh FOMO bubbles up.
Drilling into the technicals, trend indicators point sharply higher: the Average Directional Index is strong, signaling a robust trend, while positive directional momentum is miles ahead of the bears. The weekly MACD shows acceleration, and oscillators are flashing bullish signals—momentum and Awesome Oscillator readings remain elevated, confirming the uptrend’s force. With HYPE well above its key exponential moving averages, there’s little doubt the bulls have command, but keep an eye on the $44 barrier; a clean break could send price into a fresh price discovery phase, while aggressive sellers may target support down at $36 if a bout of profit-taking kicks in. RSI is entering classic overbought territory, hinting at the risk of a steep correction if euphoria gives way—traders should brace for heightened volatility and consider that buying at extremes usually comes with amplified risk. If the bullish momentum continues and buyers clear resistance, there’s little overhead supply to stop an extended run; but if bears regain control, a pullback toward recent moving averages won’t surprise me. I’d love to see this breakout hold, but as always—remember, you’re not in the red until you sell.
Compound (COMP) Price Analysis

| Crypto | Close | 1W% | 1M% | RSI | ADX | MACD | CCI 20 |
|---|---|---|---|---|---|---|---|
| COMPOUND(COMP) | $54.52 | 19.31% | 19.17% | 60.7 | 30.8 | 3.20 | 69.45 |
After a lengthy stretch of lackluster trading and an extended decline, Compound (COMP) just delivered an eye-catching 19% rally on the week, snapping back to close near $54.50. That places it squarely near the monthly high and marks a sharp reversal from the brutal six-month drawdown, which shaved off almost half its value. It’s refreshing to see this kind of upside momentum after such a prolonged downtrend—almost a relief rally as sidelined bulls finally flex their muscle. The technical outlook suggests the tide’s turning: bullish momentum is stirring, fueled by renewed buyer interest and a fresh wave of profit-taking. If Compound can keep riding this uptick, the door is open for a proper trend reversal, but there’s still work ahead for the bulls.
Zooming into the technicals, Compound displays swelling momentum across several indicators. The average directional index paints a strengthening trend, while positive directional indicators now dwarf the lagging negative side—clear evidence support is gaining traction. The MACD lines have flipped, with the weekly MACD turning positive and the signal line now trailing, often a prelude to extended rallies if supported by volume. Oscillators, meanwhile, are racing higher: the RSI has charged through the typical ‘neutral’ zone, inching ever closer to overbought territory—a spot where I’d watch for aggressive profit booking, but as of now, no definitive reversal signal. Price is now trading solidly above the 10, 20, and 30-period EMAs, a bullish alignment and another sign bulls are regaining control. Immediate resistance sits at the recent monthly high ($62.70); should COMP break through with conviction, the next challenge becomes the psychological $70 level. On the flip side, if sellers push back and Compound stumbles below the EMA cluster around $50, risks mount for a return toward monthly support just above $39. For now, momentum and trend signals stack up bullishly—Compound seems primed for further upside, provided market nerves don’t spoil the party.
Breakout or Reversal Ahead?
Aave continues to hover near overbought territories, suggesting a need for caution, while Bitcoin Cash tests its resistance — both are poised at pivotal points. HYPE and Compound show signs of strong momentum, yet their path forward depends on maintaining this trajectory. The coming sessions will be crucial in determining whether these coins capitalize on their recent gains or succumb to profit-taking pressures.