Aave Maker and Compound Eye Explosive Breakouts as Bulls Circle Key Resistance
As Aave, Maker, and Compound emerge from subdued June limelight with a remarkable 25% to 26% monthly performance, an intriguing technical landscape unfolds. Each protocol is grappling with significant resistance levels after recent highs, teasing potential breakouts that could redefine momentum in DeFi markets. The tension lies in whether bullish momentum can propel these assets through overhead hurdles or if exhaustion will invite profit-taking pressures. Let’s take a closer look at the signals behind the move.
Aave (AAVE) Price Analysis
| Crypto | Close | 1W% | 1M% | RSI | ADX | MACD | CCI 20 | AAVE(AAVE) | $287.17 | 14.36% | 24.68% | 60.8 | 28.5 | 16.19 | 88.51 |
|---|
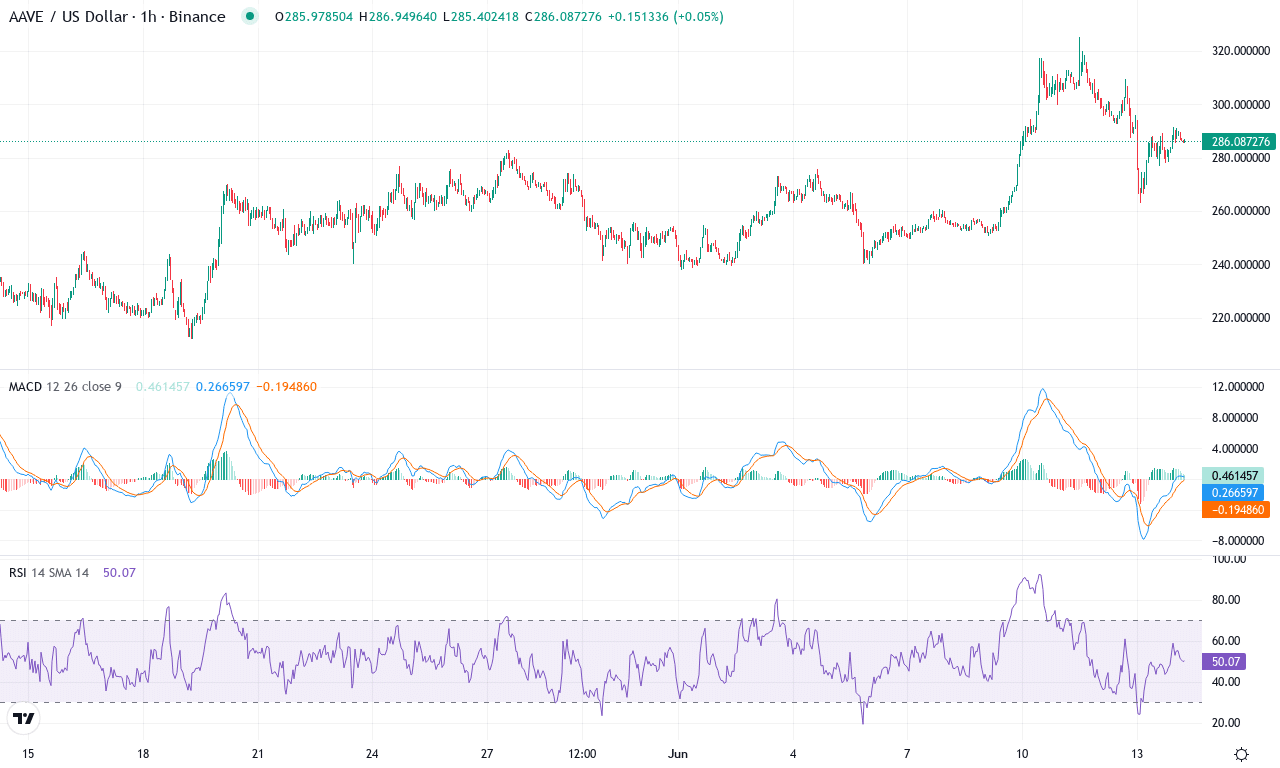
After an explosive 25% surge this month and an impressive 65% gain over the past quarter, Aave is commanding attention across crypto markets. The protocol’s price powered to a high above $325 before a modest pullback, with bulls showing renewed conviction after last week’s robust 14% advance. This bounce comes as broader DeFi sentiment improves and traders chase momentum in tier-one altcoins. On the macro view, Aave’s six-month performance remains underwater, but recent breakout action and surging volatility suggest the tide may be turning. The technical outlook suggests buyers are regaining control, and if strength persists above current levels, Aave could target fresh local highs in the weeks ahead.
The trend indicators are lining up for upside continuation—directional gauges like ADX show a strong trend in play, while the positive directional index is confidently leading. The weekly MACD illustrates accelerating bullish momentum, and the histogram’s expansion aligns with swelling oscillators. Oscillator readings, including momentum and AO, are ticking higher, although RSI sits in neutral territory, giving prices room to run before signaling overbought conditions. The price is carving out higher lows above all major moving averages, a bullish sign, with the 10-day EMA acting as solid support near $282. Immediate resistance is visible near the recent peak around $325; a break above that level could unlock a quick move toward the pivot at $351. But if sellers push prices down, watch for a pullback to the $242-$258 region, where moving average confluence and psychological support await. Momentum is picking up fast here—if Aave clears resistance, I’d be watching closely for a volatility surge and wouldn’t want to miss the ride.
Maker (MKR) Price Analysis
| Crypto | Close | 1W% | 1M% | RSI | ADX | MACD | CCI 20 | MAKER(MKR) | $2141.00 | 25.94% | 14.13% | 65.5 | 25.7 | 115.21 | 146.76 |
|---|
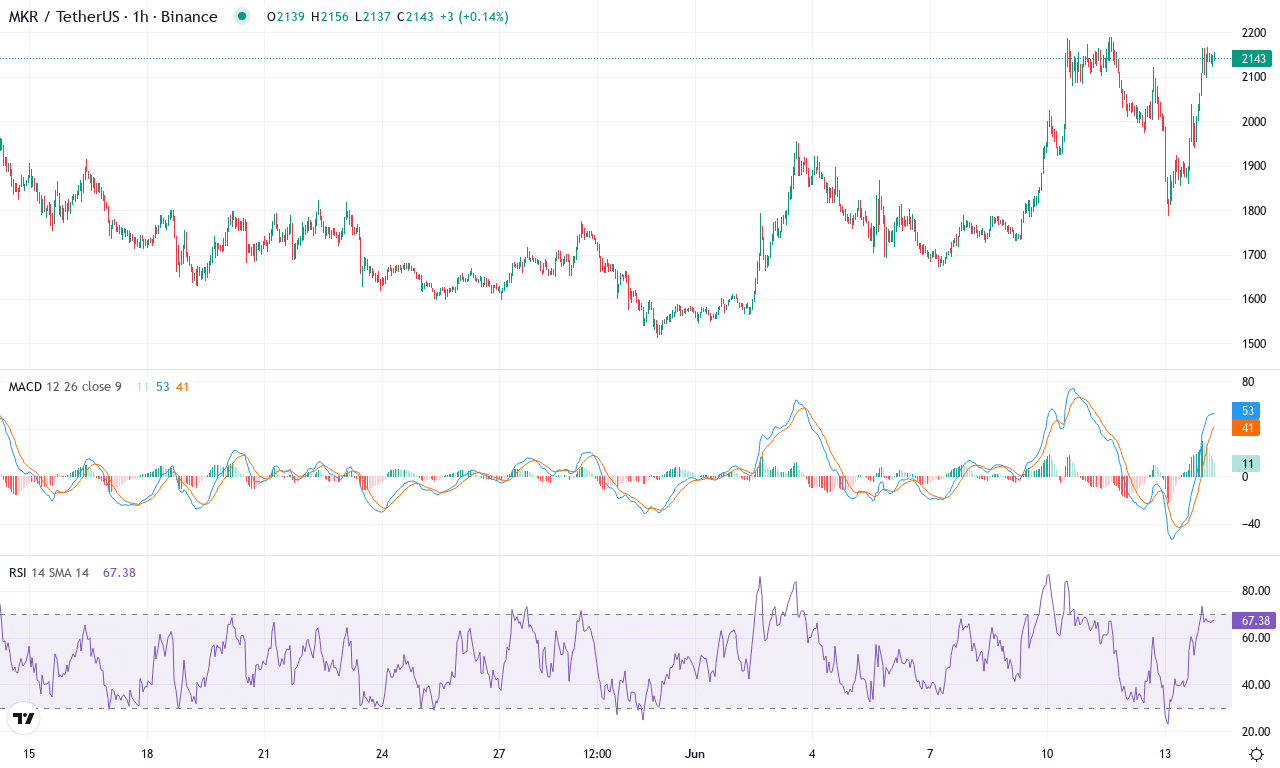
Maker (MKR) is putting on a formidable show this month, surging almost 26% in the last week alone and notching a robust 14% gain for the month—a bold rebound after months of choppy action. With price closing at $2,141—just off its monthly high of $2,190—the bulls are clearly flexing their muscles. That marks a staggering 76% rally over the past three months, and the six-month trend keeps grinding higher, even if the longer-term yearly performance lags a bit. Momentum seems firmly in bull territory, leaving shorts seriously squeezed above the $2,000 psychological handle. The technical outlook suggests that after such a vertical move, the market could be setting up for a high-stakes breakout—or a steep profit-taking correction if exhaustion creeps in.
Diving deeper, the trend indicators speak volumes: the average directional index is elevated, while a punchy spread between positive and negative directional lines underscores the surge in bullish momentum. The weekly MACD is accelerating hard to the upside, and oscillators—from the RSI in the mid-60s to a blistering CCI and roaring Awesome Oscillator—signal that buyers remain firmly in control. MKR is trading cleanly above all major exponential moving averages, and the price sits well above the $1,880–$1,900 baseline support range—an area now acting as a launchpad for further gains. Critical resistance waits near $2,190, coinciding with the monthly high and Classic R2 pivot; if bulls rip through that, eyes turn to $2,730 as the next technical target. However, if bears mount a counterattack and force MKR back under $2,000, risks of a sharp unwind increase, with the next major support kicking in near $1,730. All signs point to breakout momentum—but after this run, keep an eye out for a profit-taking surge. I’d love to see MKR shatter $2,200—though after such intensity, I’m keeping my stops tight. Stay nimble.
Compound (COMP) Price Analysis
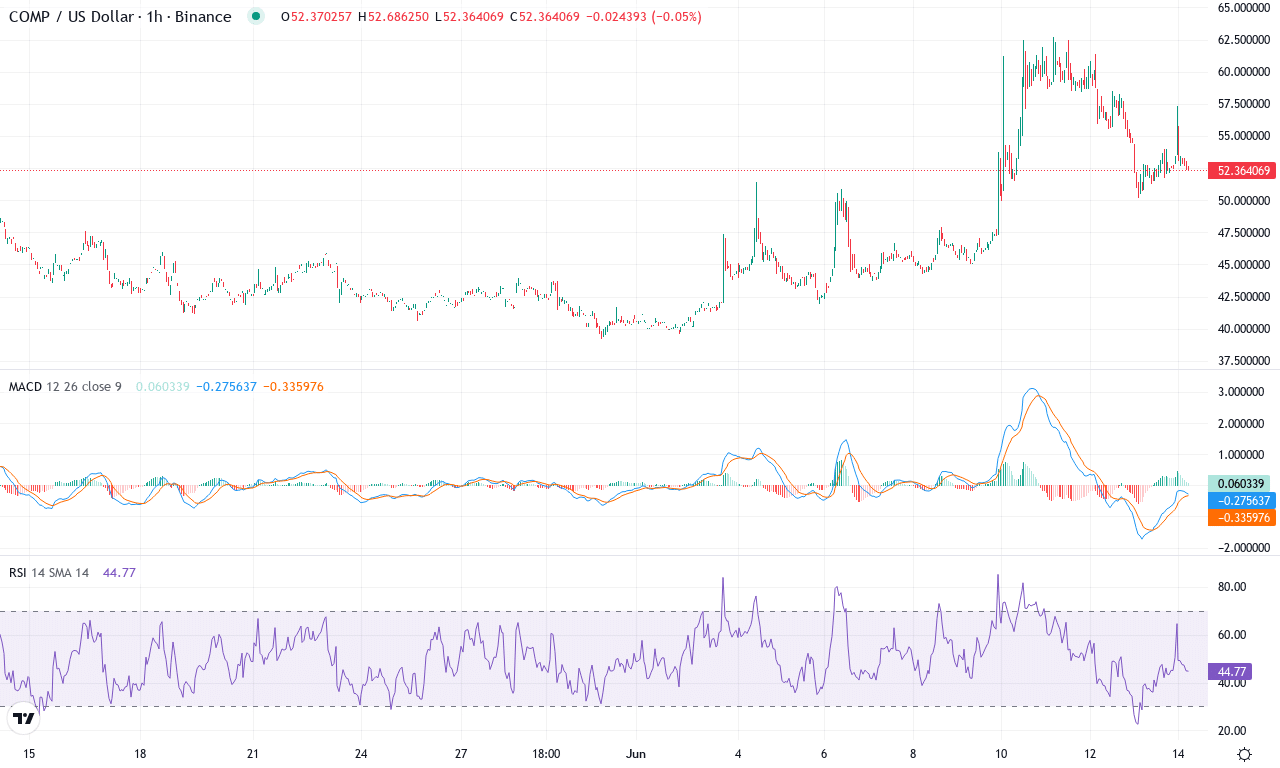
| Crypto | Close | 1W% | 1M% | RSI | ADX | MACD | CCI 20 | COMPOUND(COMP) | $52.80 | 18.75% | 14.04% | 58.4 | 31.1 | 3.33 | 88.28 |
|---|
After an especially turbulent six months, Compound (COMP) is grabbing traders’ attention again with a sharp 18% rally this week and nearly 14% gains for the month—impressive numbers given the protocol’s longer-term decline. What’s remarkable is how COMP has shrugged off recent bearish momentum, slingshotting from monthly lows around $39 to close above $52. The token’s price action is now butting right up against a meaningful resistance zone near its monthly high around $62, drawing both excitement and apprehension from market watchers. After months in the doldrums, there’s a sense the tide could finally be turning for Compound, but traders should brace themselves: volatility is rising, and the next big move might be just around the corner.
Technically speaking, trend indicators are gathering bullish steam—a decisive shift after the brutal 6-month drawdown. The average directional index is climbing, accompanied by strengthening positive pressure, which implies that this rally has backbone. The weekly MACD is almost ready to flip bullish, and oscillators like the Awesome Oscillator are turning positive for the first time in weeks. Momentum readings are swelling, suggesting buyers are gradually regaining control, while the RSI, hovering in the low-50s, is far from overbought territory and signals there’s still room for upside. Price is now pressing slightly above its 10- and 20-day exponential moving averages, showing short-term traders are back in the driver’s seat. The key to sustaining this momentum? Bulls must clear the $62 resistance decisively; if they succeed, a squeeze toward the $68-$70 zone isn’t out of the question. However, a failed breakout or profit-taking surge here could send COMP quickly sliding back to support around $48. Personally, I’m thrilled to finally see Compound waking up—just remember, catching a new trend early always comes with risk, so size positions wisely as excitement builds.
Will DeFi Bulls Break Through?
Aave hovers near its next resistance, while Maker and Compound press against crucial breakout points. Sustained bullish pressure could push these coins into new territories, but caution prevails as resistance tests mount. Observers watch closely for volume spikes and price action confirmations in determining whether DeFi bulls will advance or stall.