AERO AB And Kaia Bulls Press Highs As Resistance Cracks—Is A Volatility Frenzy Next
Aerodrome Finance and Kaia have escaped their respective doldrums with explosive moves, leaving traders awestruck at their impressive gains. AERO’s breathtaking 68% weekly run and Kaia’s near-49% monthly climb put both projects in the spotlight as they confront pivotal resistance levels. As prices draw closer to important psychological highs, bullish sentiment is riding high, but the suspense lingers—can this momentum defy exhaustion, or are these two at risk of a retreat? Let’s break down the technical setup across the board.
Aerodrome Finance (AERO) Price Analysis
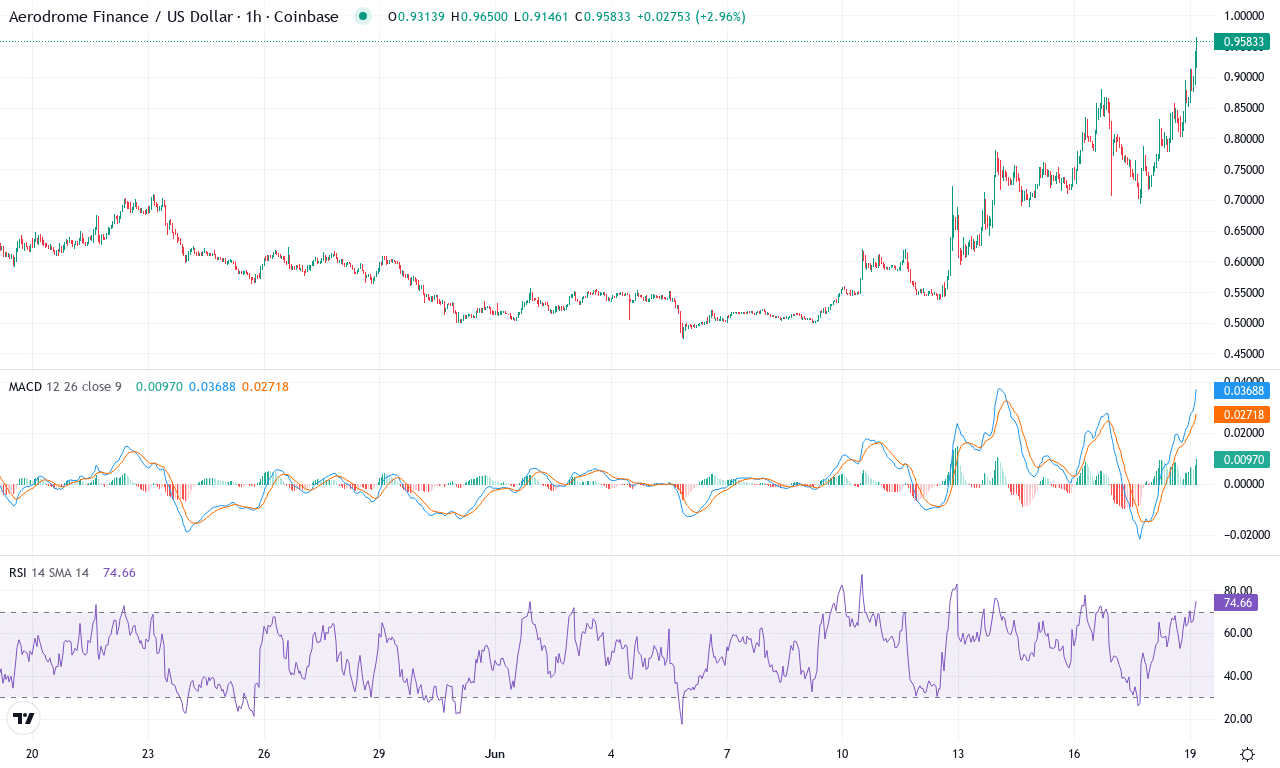
| Crypto | Close | 1W% | 1M% | RSI | ADX | MACD | CCI 20 | AERODROME FINANCE(AERO) | $0.93 | 68.04% | 47.96% | 70.3 | 34.3 | 0.07 | 172.64 |
|---|
After weeks of compressed volatility, Aerodrome Finance (AERO) is exploding onto traders’ radar with a staggering 68% weekly surge and nearly 48% monthly rally. This breakout comes on the heels of a choppy 6-month stretch that saw a gut-wrenching drawdown, but bulls have reclaimed the upper hand and are pushing price back toward its monthly highs near $0.94. Short-term momentum is roaring—anyone watching last week’s candles knows exactly what I mean—and price is now perched right at both the short-term and longer-term moving averages, a clear sign that institutional inflows could be heating up alongside retail FOMO. If buyers can fend off profit-taking, AERO could be on the cusp of a fresh leg higher—potentially setting new yearly highs if the broader market stays risk-on.
Technically, trend indicators are screaming strength. The ADX registers a powerful uptrend, while the positive directional index is leaving the negative index in the dust—classic breakout momentum. Weekly MACD has swung back into acceleration mode, complemented by momentum oscillators confirming sustained bullish energy. The RSI is pushing into overbought territory, hinting at exhaustion risks, but price has broken convincingly above all major exponential moving averages from the 10-day up to the 200-day; rarely do you see all signals so well aligned. Key resistance stands at the monthly high ($0.94), while immediate support emerges near the daily pivot around $0.71. If bulls smash through $0.94, the path clears toward psychological resistance at $1.00—a breakout above that would be electric and could ignite a volatility surge. However, faltering momentum or a failed retest of support might invite a steep correction back toward $0.60. I’m watching closely here; after such a violent move, whiplash is always a risk—but right now, all signs favor the bulls.
AB (AB) Price Analysis
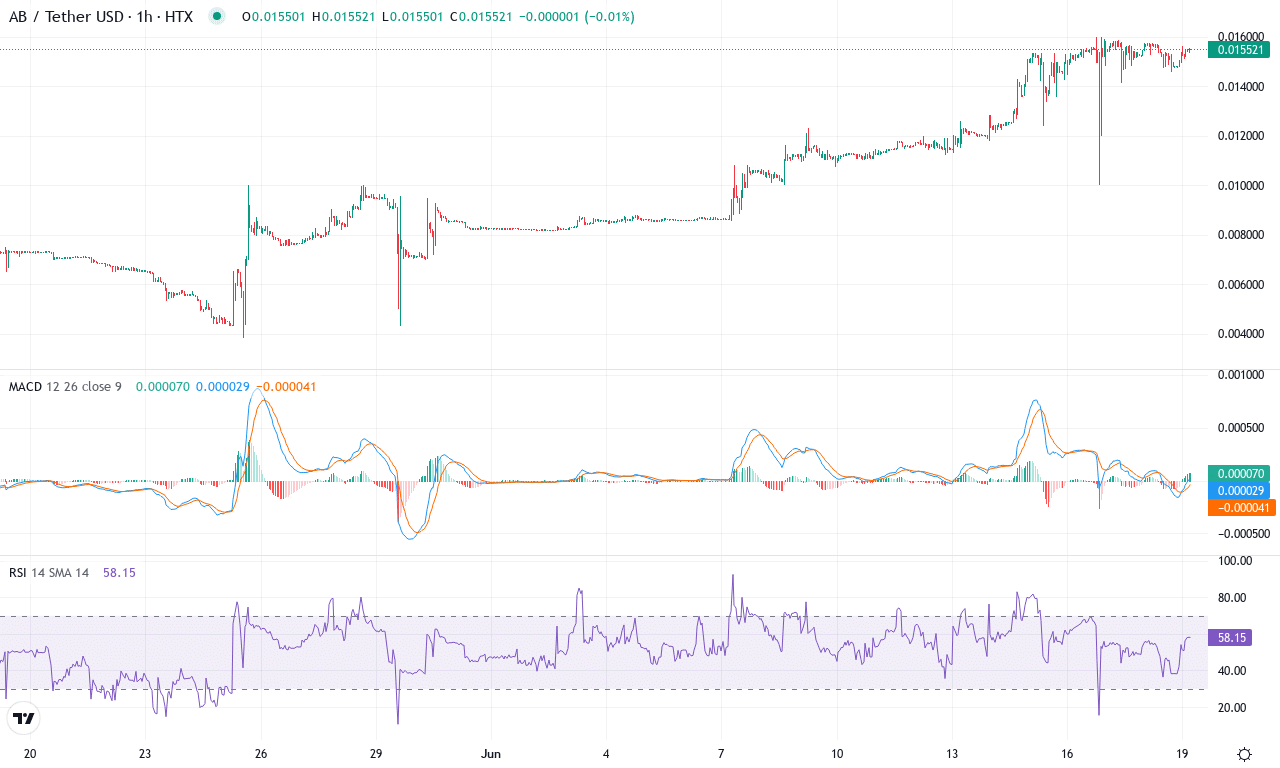
| Crypto | Close | 1W% | 1M% | RSI | ADX | MACD | CCI 20 | AB(AB) | $0.02 | 32.35% | 113.58% | 77.9 | 28.1 | 0.00 | 130.24 |
|---|
After an explosive month that saw AB surge a staggering 113%, this altcoin is back on traders’ radars in a big way. Following weeks of lackluster performance, AB has rocketed from its monthly low near $0.0038 to close just under $0.016. Short-term momentum has reignited, with a 32% gain over the past week—a strong departure from last quarter’s tepid action. From a macro perspective, the outsized six-month and yearly gains underscore a trend shift: AB has moved off the sidelines and is now flexing serious bullish momentum. If you’ve been waiting for a resurgence, this is the kind of velocity that can reshape a trader’s conviction.
Technically, trend indicators paint a powerful upward picture. The average directional index shows the uptrend is strong, while the positive directional indicator is pulling away from its negative counterpart—classic signs of breakout momentum. The weekly MACD displays continued acceleration, and both oscillators and momentum readings remain firmly in bull territory. AB is trading well above its fast-moving averages, further confirming near-term control by buyers. With price now brushing its monthly resistance just below $0.016, any decisive breakout above this key level would likely invite a flood of momentum traders, with the next psychological target near $0.022. Should profit-taking set in or momentum wane, however, look for the $0.0116–$0.0120 area to provide support, built on converging moving averages and previous breakout zones. I have to admit—I get a little excited when a chart rips this hard. Don’t get overleveraged up here, but all signs point to a bullish continuation unless sellers stage a dramatic reversal.
Kaia (KAIA) Price Analysis
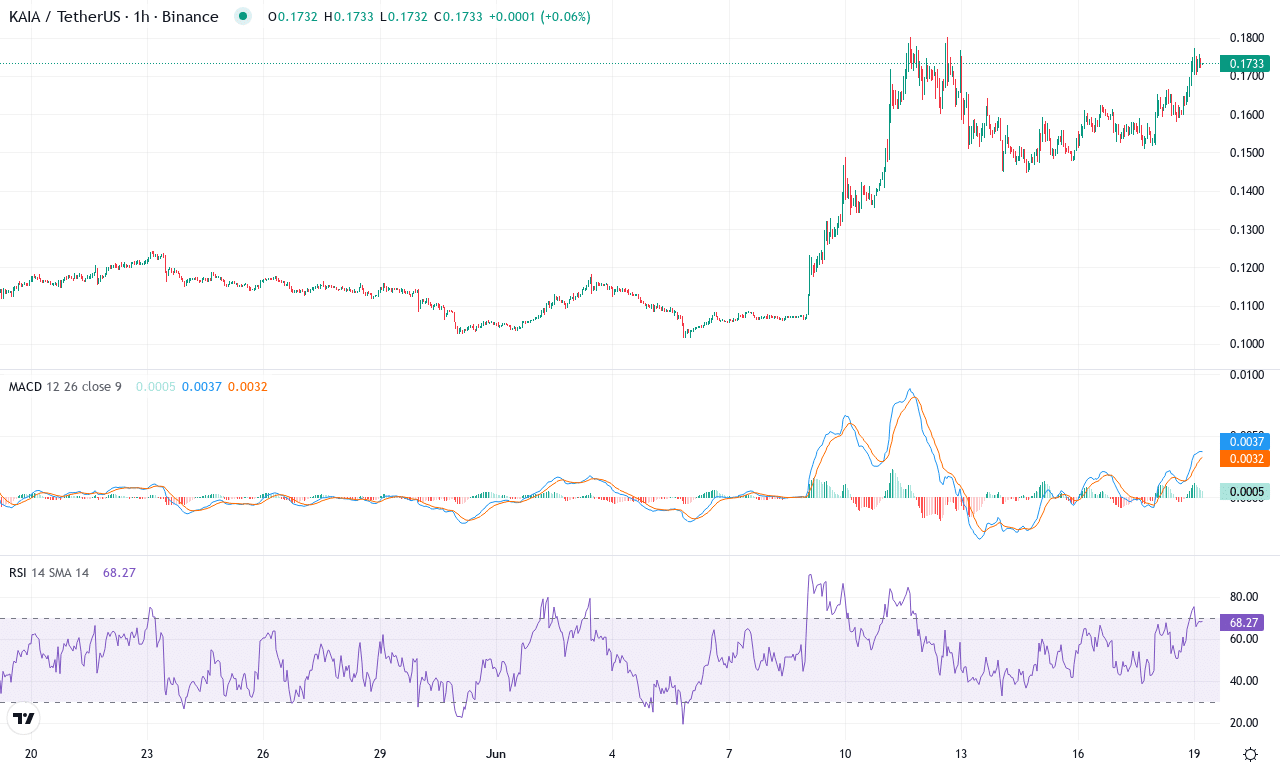
| Crypto | Close | 1W% | 1M% | RSI | ADX | MACD | CCI 20 | KAIA(KAIA) | $0.17 | 2.37% | 48.58% | 69.0 | 34.0 | 0.01 | 104.99 |
|---|
After a spectacular month that saw Kaia rocket nearly 49%, bullish sentiment remains firmly in play, with short-term gains building on a striking 59% rally across three months. This acceleration is remarkable given the coin’s 26% six-month drawdown, underscoring a true trend reversal and the kind of wild swing that makes crypto trading addictive. With price now settling near $0.173—just beneath this month’s $0.18 high—momentum is swelling, and traders are watching closely to see if Kaia can push through psychological resistance above $0.18. If you’ve been riding this uptrend, it’s been a thrilling climb; but after such a surge, volatility is a double-edged sword, and sharp profit booking could spark steep corrections just as quickly.
Diving into Kaia’s technicals, the trend indicators broadcast strong bullish momentum: the ADX hovers in the mid-30s, signaling a confident trend, while positive directional movement outpaces sellers significantly. The weekly MACD just crossed above its signal, pointing to accelerating upside momentum, and oscillators like the Awesome Oscillator and momentum index are both flashing green—typically strong confirmations for trend-followers. Kaia is trading well above its major exponential moving averages, indicating buyers are in clear control; however, RSI is climbing toward the overbought zone, and the Commodity Channel Index (CCI) just clocked an eye-watering +105. When oscillators get this frothy, it’s often a prelude to whipsaw price action or a bout of profit-taking. The next key hurdle sits at $0.18; a clean breakout could unleash a volatility surge toward $0.20 and beyond. Conversely, if bullish momentum stalls, look for a healthy pullback to support near $0.14, where moving averages cluster and dip-buyers may reassert themselves. All signs point to an inflection—whether Kaia explodes higher or stalls, it’s bound to be an emotional ride.
Navigating the Storm of Breakouts
Aero’s surge beyond its former cap and Kaia’s approach to critical highs signal potential for prolonged bullish runs, though caution is warranted with resistance tests imminent. Sustained buying pressure is necessary to prevent a sharp reversal, making these levels crucial for future direction. Traders should remain vigilant as volatility looms, ready for either a continuation of exuberance or a rapid pullback.