
AERO Bulls Charge While TAO and GNO Hold Breath at Pivotal Breakdown Zones
Bitcoin and Ethereum have both posted impressive monthly gains, but key resistance zones now stand in the way. In parallel, Bittensor (TAO) and Gnosis (GNO) are poised at pivotal breakdown levels after weeks of volatile swings, creating a dynamic backdrop for crypto traders. As price approaches psychological levels, bulls face a decisive test—will bullish strength continue or give way to short-term exhaustion? Let’s break down the technical setup across the board.
Bittensor (TAO) Price Analysis
| Crypto | Close | 1W% | 1M% | RSI | ADX | MACD | CCI 20 | BITTENSOR(TAO) | $387.00 | 0.99% | -8.98% | 48.2 | 14.0 | -7.30 | -45.69 |
|---|
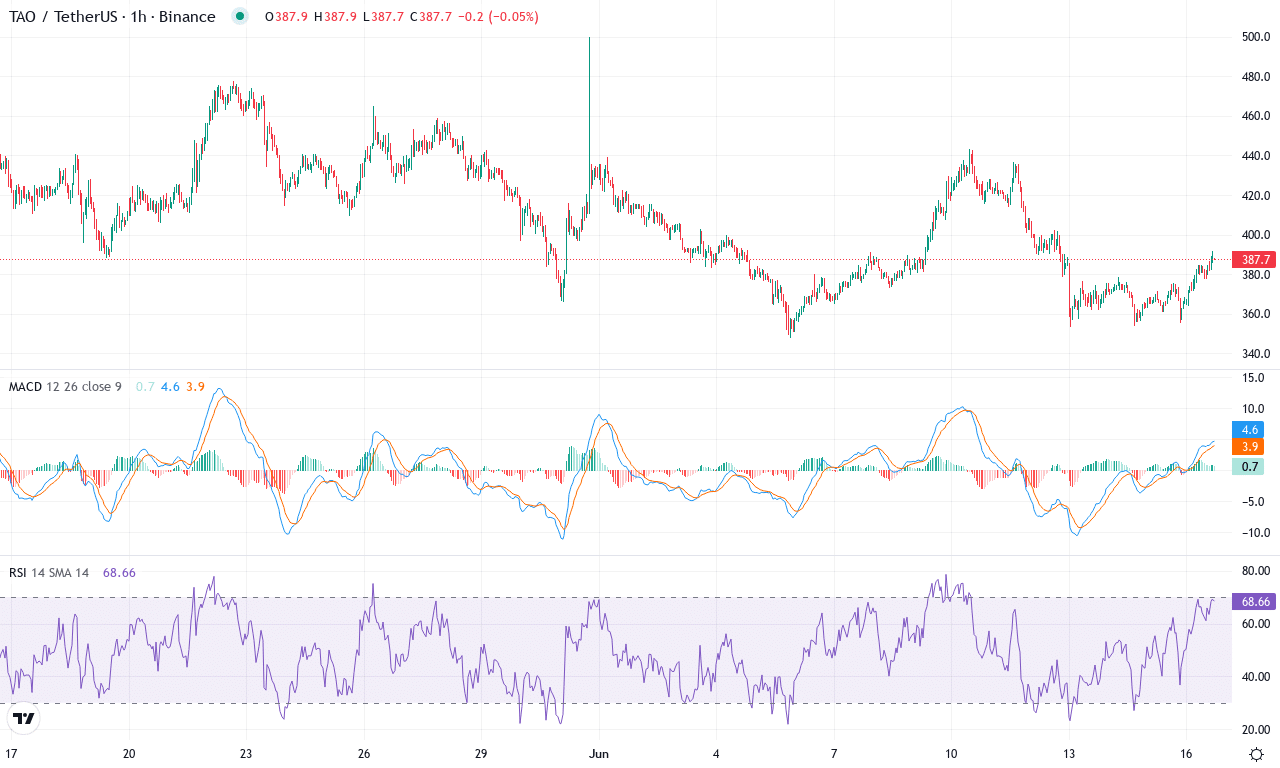
After a month of volatile swings, Bittensor (TAO) is grabbing attention with its sharp retracement from a recent high of $500, now consolidating around $387. Despite a bruising 9% drop this week and an 8% slip over the month, its 3-month rally remains impressive at +51%—though bulls have clearly hit turbulence. The technical outlook suggests that bearish momentum is building, as TAO struggles to hold key swing support. Yet the broader narrative isn’t entirely bleak: over the past year, TAO has posted a robust 28% advance. Price action analysis paints a tense picture: the drawdown from highs brings the asset right back into a battle zone near the prior monthly low. With volatility still elevated, I’m closely watching to see if buyers can fend off a steeper correction, or if bears will seize control and trigger fresh liquidation cascades.
Diving into the technicals, trend indicators are flashing warnings—trend strength remains elevated, but directional signals have flipped from bullish to nearly deadlocked, suggesting mounting indecision. The MACD line deepened below its signal this week, underscoring bearish acceleration. Oscillators generally echo this fatigue: momentum has turned negative, and the RSI is slipping toward neutral from previously robust levels, hinting that bullish momentum is losing steam. Price is now teetering just above the cluster of short-term exponential moving averages, with the 10- through 50-day lines converging tightly below the spot price—any breakdown here could open the door to a slippery descent toward $346, the next meaningful support. On the upside, if buyers manage to reclaim control and TAO surges through resistance at $423, a quick move toward $500 is not out of the question. This is a classic inflection point, and the next sessions could define the trend for weeks ahead. As a trader, I’m watching this standoff with bated breath—if bulls blink, risks of an extended fall grow sharply.
Gnosis (GNO) Price Analysis
| Crypto | Close | 1W% | 1M% | RSI | ADX | MACD | CCI 20 | GNOSIS(GNO) | $117.79 | -1.79% | -13.04% | 42.9 | 19.5 | -3.57 | -107.71 |
|---|
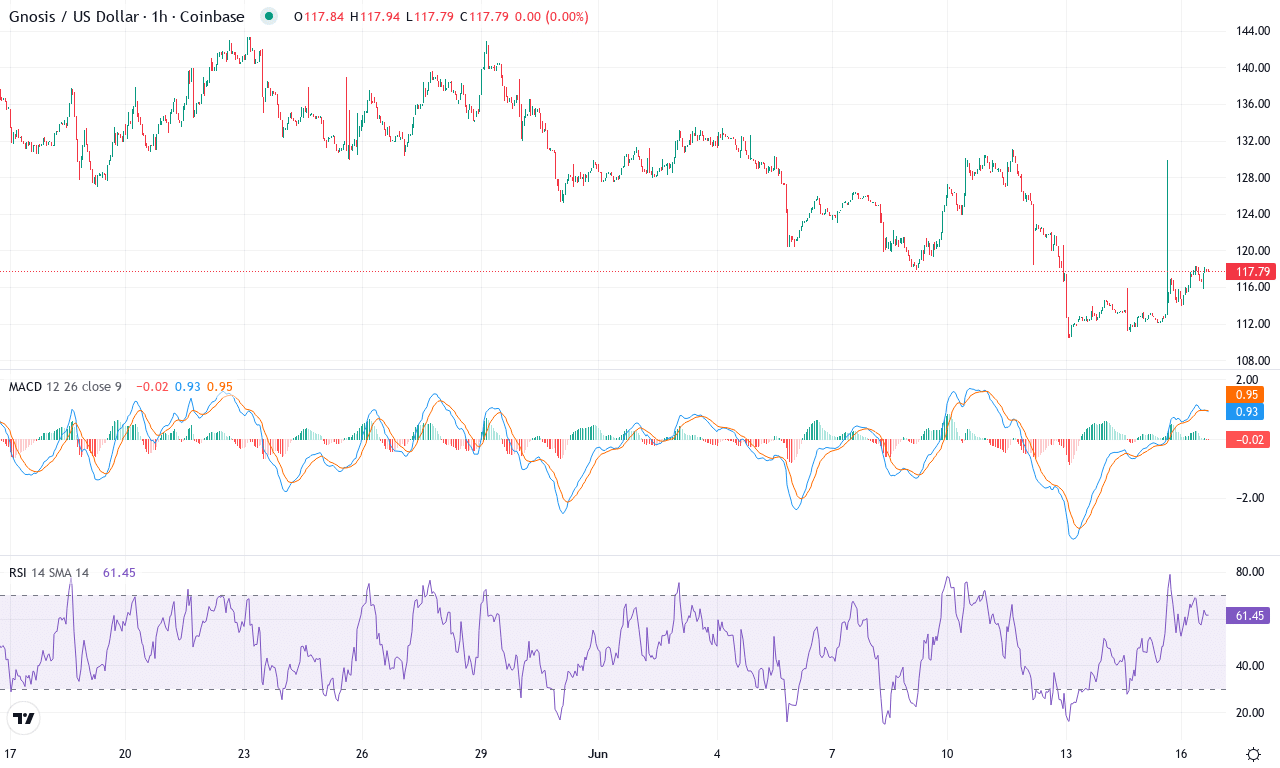
After a bruising month that saw Gnosis tumble over 13% and tag a low near $110, the token remains under heavy pressure. The longer-term technical picture paints a cautionary tale—GNO has bled out almost 64% over the past year, with weak bounces quickly fizzling into more selling. Recent price action is defined by lethargy; the past week’s drop was mild, but the loss of key support zones and failure to attract dip buyers is a classic sign of apathy. This backdrop makes me uneasy; when bearish momentum lingers for months, sellers get emboldened, and fresh downside volatility is always a risk. Still, Gnosis isn’t yet in freefall territory—if recent lows around $110 can hold, we might at least see a pause in the carnage.
Technically, the trend indicators are painting a grim picture. The ADX shows a strong trend, while the negative directional index outweighs the positive—bears remain solidly in control. The weekly MACD underscores this with its deepening negative slope and persistent gap below the signal line, signaling heavy bearish momentum. Oscillators look exhausted, with RSI stuck in the lower 30s—dangerously close to oversold—but not registering capitulation. GNO trades below all its major exponential moving averages, a sign the market has consistently priced in lower highs and lower lows. Immediate resistance looms at $128, and the emotionally charged $150 level is the next true test for any relief rally. If sellers push price below $110, technical outlook suggests a steep correction towards $86, with little in the way of historical support. But—and it’s a big but—should bulls stage an unexpected breakout above $128, we could see some short covering and a quick run toward $150. In my view, risks of an extended fall are real; tight stops and cautious sizing are essential here.
Aerodrome Finance (AERO) Price Analysis
| Crypto | Close | 1W% | 1M% | RSI | ADX | MACD | CCI 20 | AERODROME FINANCE(AERO) | $0.85 | 66.41% | 30.59% | 69.5 | 27.2 | 0.04 | 211.33 |
|---|
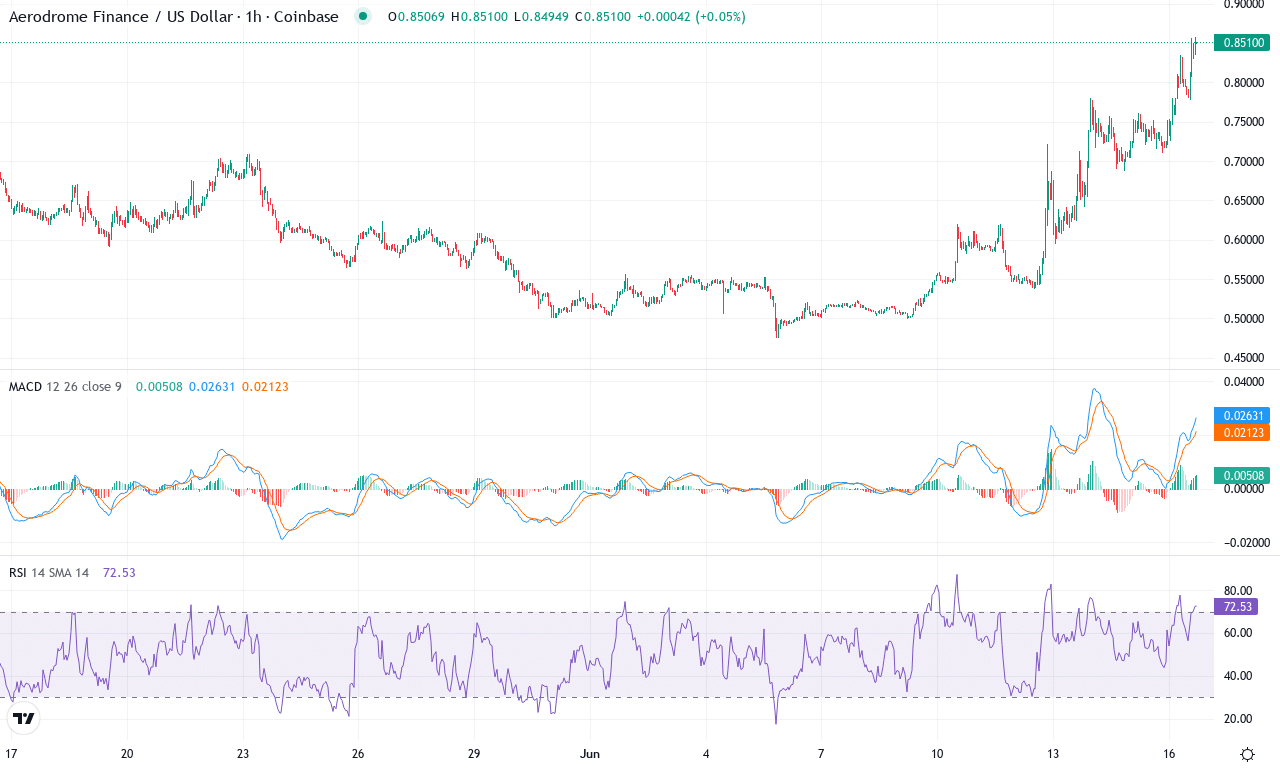
After being battered by heavy selling in the past half year, Aerodrome Finance (AERO) has come storming back, up a formidable 66% over the last week and clocking a robust 31% monthly rally. This surge marks a dramatic reversal from its six-month decline of nearly 55%. AERO’s price now hovers just below its monthly high, signaling resurgent bullish momentum and catching the eye of traders chasing breakout momentum. The technical landscape is loud and clear—after months of exaggerated volatility and shakeouts, the coin seems poised for an ambitious attempt at a sustained uptrend. As the dust of forced liquidations settles, I have to admit: It’s hard not to get excited when you see a chart spring back to life like this.
The technical outlook suggests bulls are regaining control, with trend indicators strengthening and the average directional index pointing to a powerful directional move. The weekly MACD just flipped higher and is accelerating, while oscillators confirm improving momentum and an RSI charging up toward overbought territory—a classic sign that buyers are driving the tape, albeit with overheated undertones. AERO is currently trading well above all major exponential moving averages, reinforcing breakout conviction and suggesting the path of least resistance is higher. However, the first real test for bulls awaits at resistance near $0.86; if price conquers this zone, the rally could extend quickly toward $1.21—don’t blink if volume surges here. On the downside, any faltering would likely see AERO retrace toward the $0.66–$0.71 support band. As always, managing risk is paramount—when momentum flips this hard, whipsaws can be brutal. But for now, all signs point to a market ready to run.
AB (AB) Price Analysis
| Crypto | Close | 1W% | 1M% | RSI | ADX | MACD | CCI 20 | AB(AB) | $0.02 | 38.67% | 108.34% | 80.2 | 34.2 | 0.00 | 163.50 |
|---|
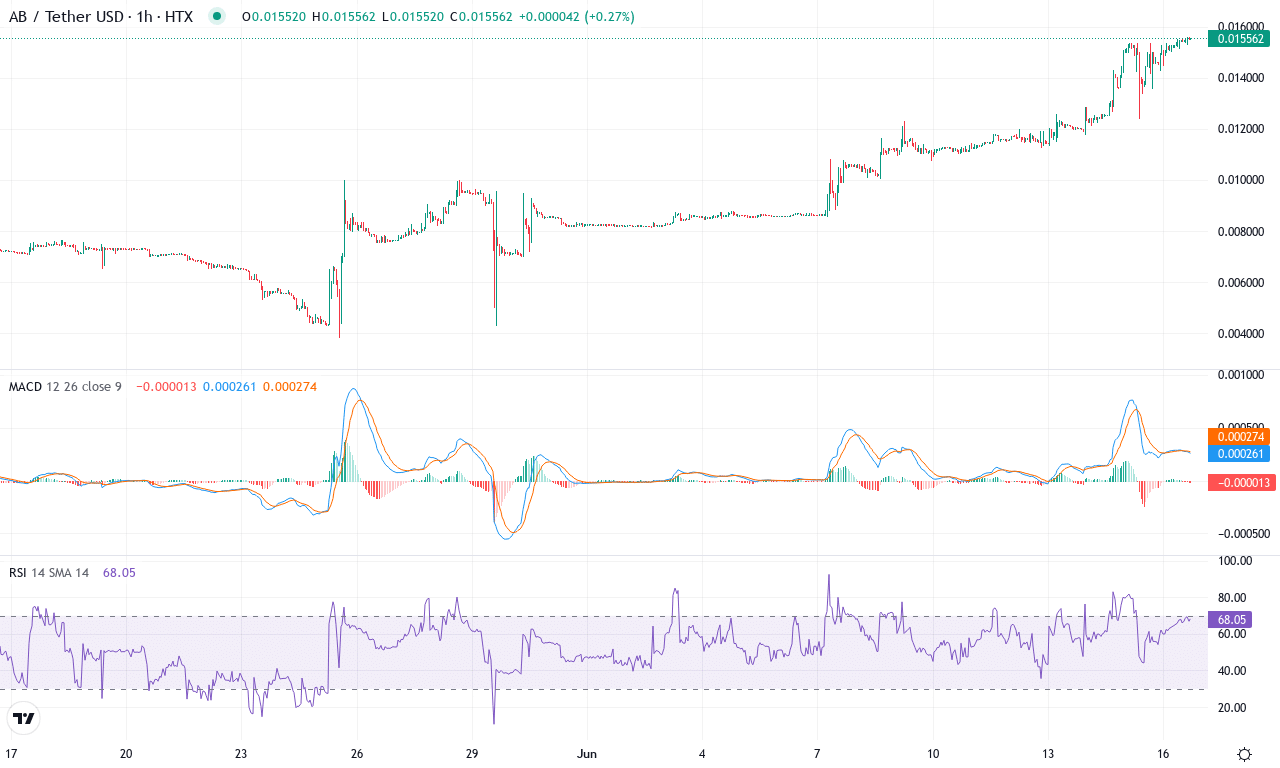
After a barnstorming month, AB is turning heads, exploding over 100% in thirty days and closing in on recent highs at $0.0156. This high-velocity rally is underscored by a blistering 38% surge in just the past week, leaving little doubt that bullish momentum has seized control. The backdrop is one of long-term strength: over the past six and even twelve months, AB has outpaced nearly all expectations, and the current close near $0.0155 keeps the asset within striking distance of its upper monthly range. For traders, the mood right now is unabashedly positive—if you’ve ridden this move, congratulations are in order—but as always with parabolic runs, the threat of a steep correction starts looming larger the higher we fly.
The technical outlook suggests the trend is both forceful and intact: a firm reading from the ADX and strong positive directional signals indicate bulls remain firmly in control. Momentum oscillators and the MACD lines both favor continuation, showing persistent acceleration and no immediate hint of bearish reversal. AB is pushing well above its key exponential moving averages—the 10, 20, and 30-period EMAs are all clustered below price, reinforcing the breakout narrative. Overbought signals are starting to blink, with RSI fast approaching levels that frequently trigger profit-booking surges. It’s a classic battleground: if bulls can manage a clean break above $0.016, the next leg could carry toward $0.022, where psychological resistance will become formidable. However, any profit-taking that drags AB back beneath support at $0.014 would raise the specter of an extended fall, with the $0.0116 pivot as a potential bounce zone. Personally, I’m watching these levels with fingers poised—euphoria is fun, but discipline is survival. All signs point upward for now—just don’t ignore your stop-loss.
Will Bulls Surpass Resistance or Falter?
Bitcoin’s buoyancy now meets a tough ceiling, while Ethereum seeks to overcome its resistance. Meanwhile, TAO and GNO await breakout confirmation, playing on the edge of their critical thresholds. The market’s next steps hinge on sustained buying pressure; traders are keenly observing if the current bullish stance can weather the looming challenges.