BCH And HYPE Teeter At Pivotal Resistance As Bulls Eye Explosive Breakouts Or Painful Reversals
Bitcoin Cash (BCH) and Hyperliquid (HYPE) find themselves at pivotal resistance levels, poised for potentially explosive breakouts or sharp reversals. BCH has recently touched a monthly high of $462 but has retreated slightly, reflecting its ongoing battle to regain bullish momentum within a cautious market environment. Meanwhile, HYPE has surged an impressive 53% this month, drawing attention as it hovers near key psychological thresholds. Will these assets sustain their upward trajectories, or are traders bracing for a turnaround? Let’s take a closer look at the signals behind these moves.
Bitcoin Cash (BCH) Price Analysis
| Crypto | Close | 1W% | 1M% | RSI | ADX | MACD | CCI 20 |
|---|---|---|---|---|---|---|---|
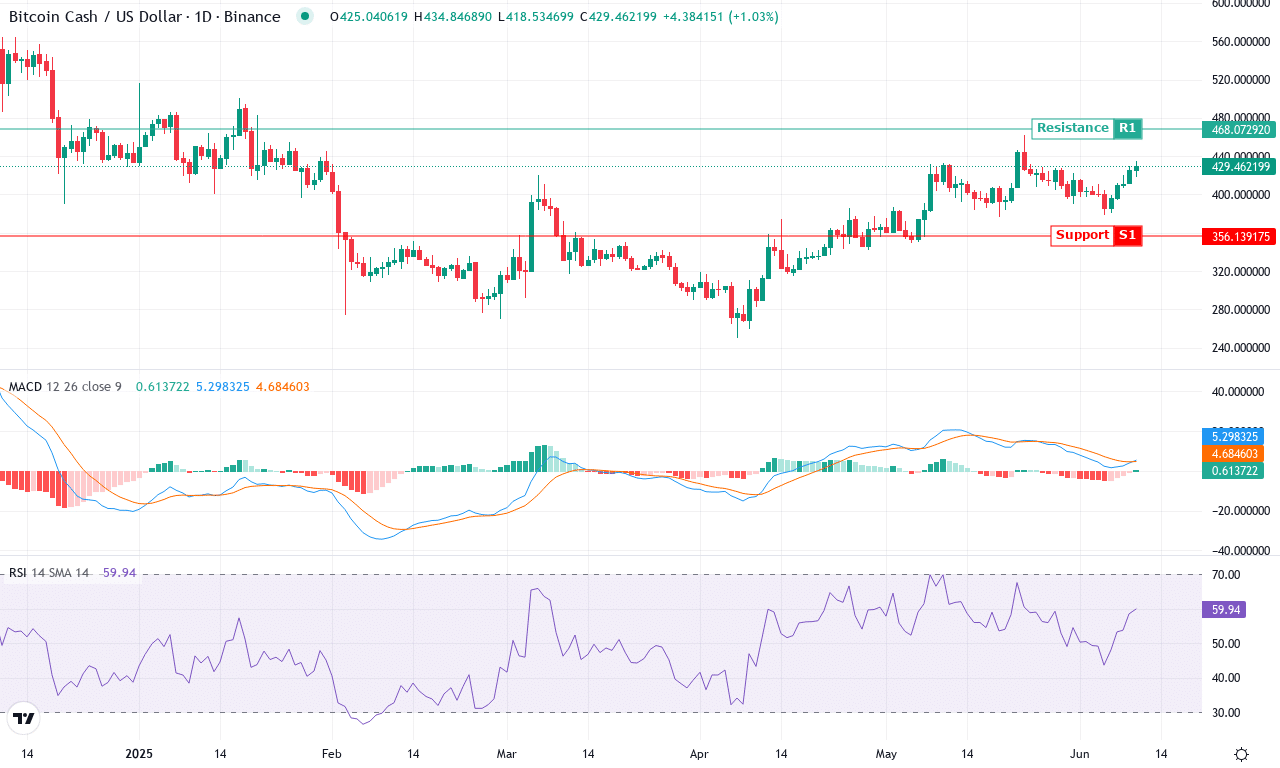
| BITCOIN CASH (BCH) | $433.13 | 7.35% | 0.58% | 61.1 | 20.1 | 5.62 | 102.45 |
After weeks of sideways range-trading, Bitcoin Cash (BCH) is starting to command attention again. The coin recently notched a monthly high near $462, but gave back some gains to close the week around $433—up over 7% on the week, though barely positive for the month. This mixed performance signals BCH’s struggle to reclaim bullish dominance, despite a robust three-month rally that saw gains above 27%. The technical outlook suggests a battle at current levels: while the broader market sentiment is cautious, BCH’s underlying trend structure hints at breakout potential if bulls manage to push decisively through overhead resistance. Personally, I’m watching this setup with mounting anticipation—if BCH surges again, we could see fireworks.
Digging into the price action analysis, trend indicators show strong upward momentum—ADX readings above 20 and positive directional movement reflect sturdy trend strength. The moving average convergence/divergence shows the weekly MACD line accelerating ahead of its signal, reinforcing the bullish case. Momentum oscillators, including the weekly RSI hovering above midline but not overbought, suggest the rally could have more room to run before exhaustion sets in. Price action remains above all major exponential moving averages, which usually precedes a fresh rally, and BCH is holding well above its primary support—anchored near $409. Major resistance looms overhead at the recent $462 high; if bulls clear this level, the next target lies toward $520. However, failure to hold the $409–$393 support zone could invite a steep correction back to the mid-$350s. Right now, all signs point to BCH setting up for a high-volatility move—be ready for rapid swings, as momentum traders may look to squeeze sellers or trigger a reversal if overhead supply proves too heavy.
Hyperliquid (HYPE) Price Analysis
| Crypto | Close | 1W% | 1M% | RSI | ADX | MACD | CCI 20 |
|---|---|---|---|---|---|---|---|
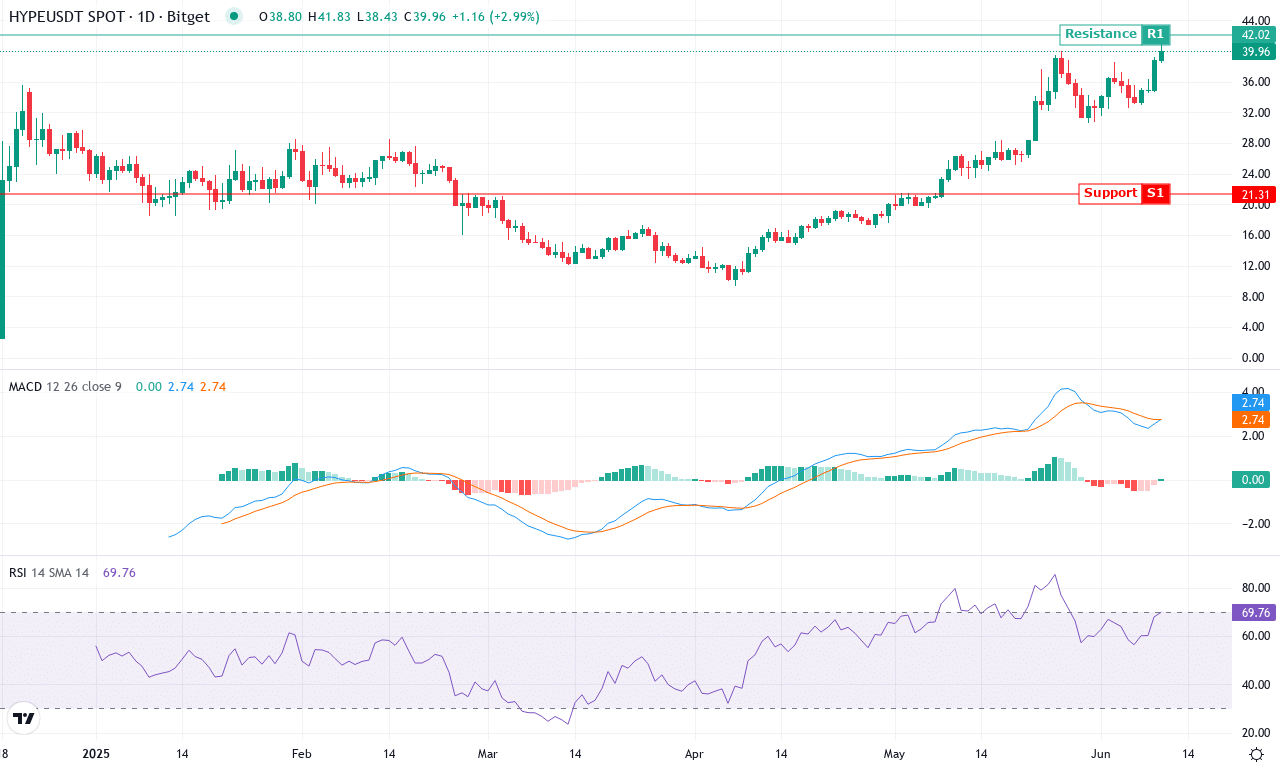
| HYPERLIQUID (HYPE) | $40.28 | 10.45% | 53.39% | 70.2 | 42.3 | 2.77 | 199.27 |
After a month marked by intense volatility and surging institutional interest, Hyperliquid (HYPE) is firmly in the spotlight. The asset exploded more than 53% on the month and sits near its monthly high, reflecting a relentless uptrend that has persisted for much of the past two quarters. After gaining an eye-popping 1,500% in just six months, HYPE’s ability to maintain bullish momentum despite profit-taking surges is both impressive and fraught with risk. There’s a palpable sense that we’re nearing an inflection point—traders are watching to see if HYPE can consolidate above the psychological $40 zone, or if a steep correction looms as RSI readings hover in elevated territory. Honestly, with this kind of price action, it’s hard not to feel the adrenaline.
The technical outlook suggests bullish momentum remains strong, with trend indicators pointing convincingly higher. The weekly MACD shows acceleration above its signal line, and positive directional indicators continue to outpace their negative counterparts—a classic recipe for breakout momentum. HYPE is holding well above all short- and long-term exponential moving averages, reinforcing its bullish structure and diminishing the odds of an abrupt trend reversal. Oscillators, including RSI and the stochastic suite, indicate the asset is entering overbought territory, raising risk for sharp profit-taking, especially if the psychological $41.80 resistance proves insurmountable. If bulls clear that ceiling, the next price target emerges near $45, while failure to hold $38 could invite a swift pullback toward the $34 support zone—a drop that would certainly test trader nerves. All signs currently favor the bulls, but in markets like these, complacency can quickly turn into regret. Stay nimble.
At the Brink: Breakout or Reversal?
Bitcoin Cash (BCH) faces a critical test at its resistance level of $462, where a successful rally could reignite bullish momentum, while failure might prompt a pullback to support levels. Hyperliquid (HYPE) continues its remarkable ascent, but traders are wary as it nears crucial psychological thresholds that could indicate either a continuation or a correction. The market stands at a crossroads, with the coming days set to reveal whether these assets have the strength to break free or if a shift in the trend is imminent.