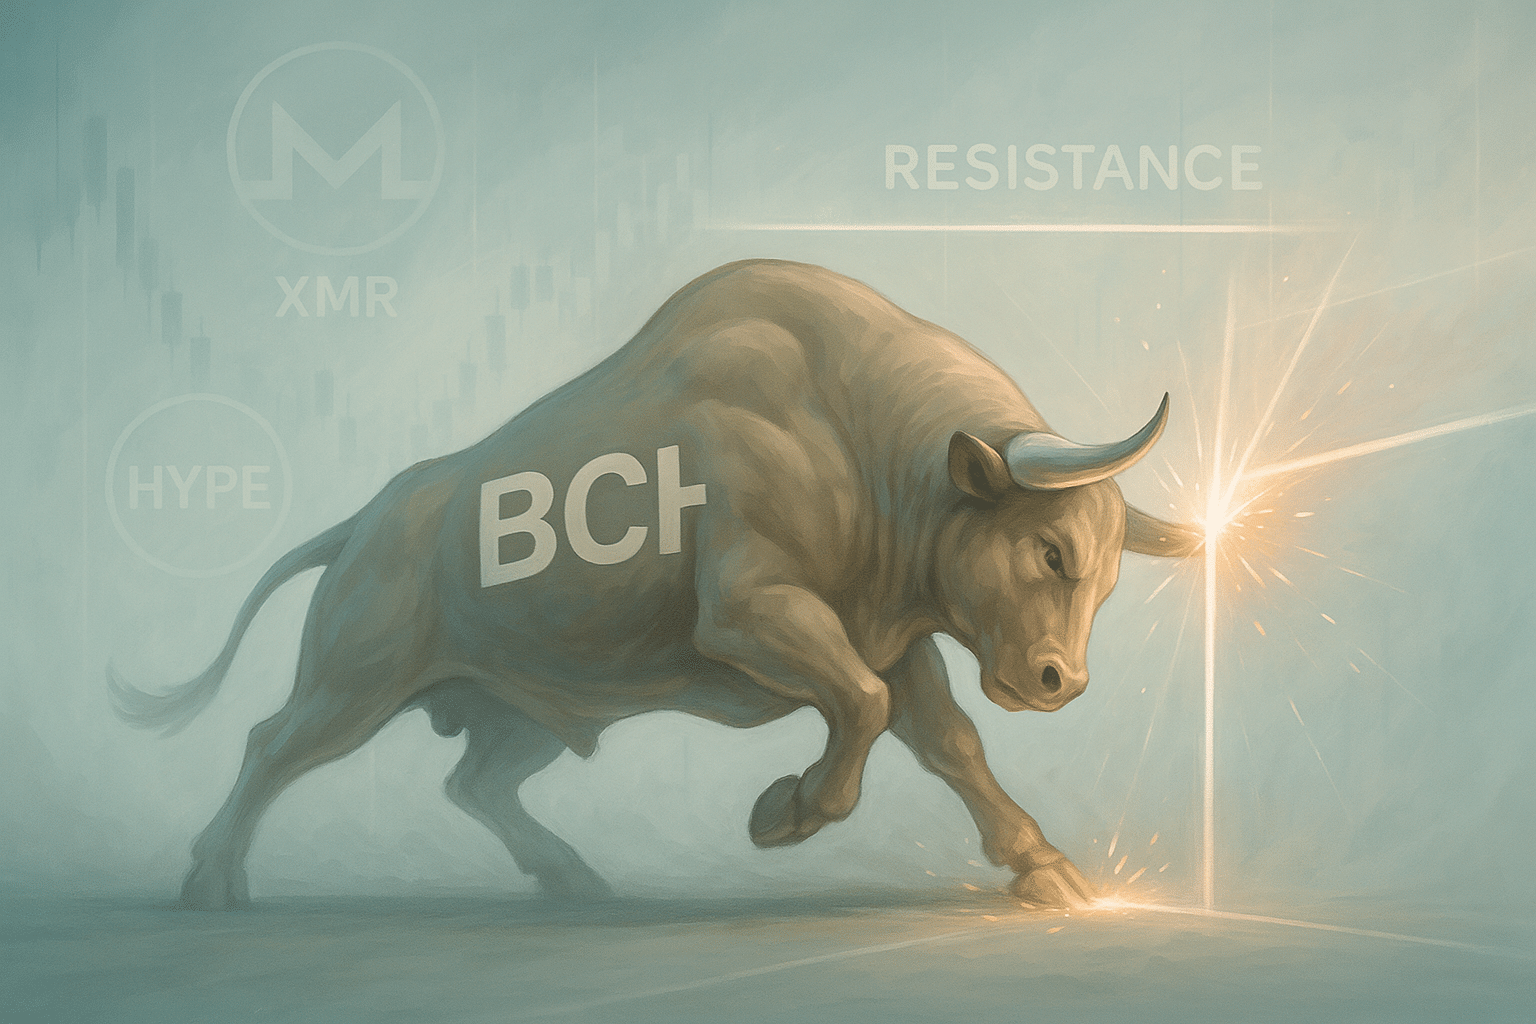
BCH Bulls Pressure Resistance as XMR and HYPE Eye Critical Inflection Zones
Fresh off a solid 15% monthly gain, Bitcoin Cash (BCH) approaches a key resistance level while attracting keen institutional interest, setting the stage for a potential breakout. Monero, despite a challenging 20% pullback, balances on technical support, hinting at a pivotal moment ahead. Meanwhile, Hyperliquid (HYPE) faces a critical test as traders digest its formidable 123% rally over the last three months. Will these assets continue their upward trajectory or face resistance from bears? Let’s take a closer look at the signals behind the move.
Bitcoin Cash (BCH) Price Analysis
| Crypto | Close | 1W% | 1M% | RSI | ADX | MACD | CCI 20 | BITCOIN CASH(BCH) | $470.90 | 4.90% | 15.61% | 60.7 | 24.1 | 19.08 | 96.53 |
|---|
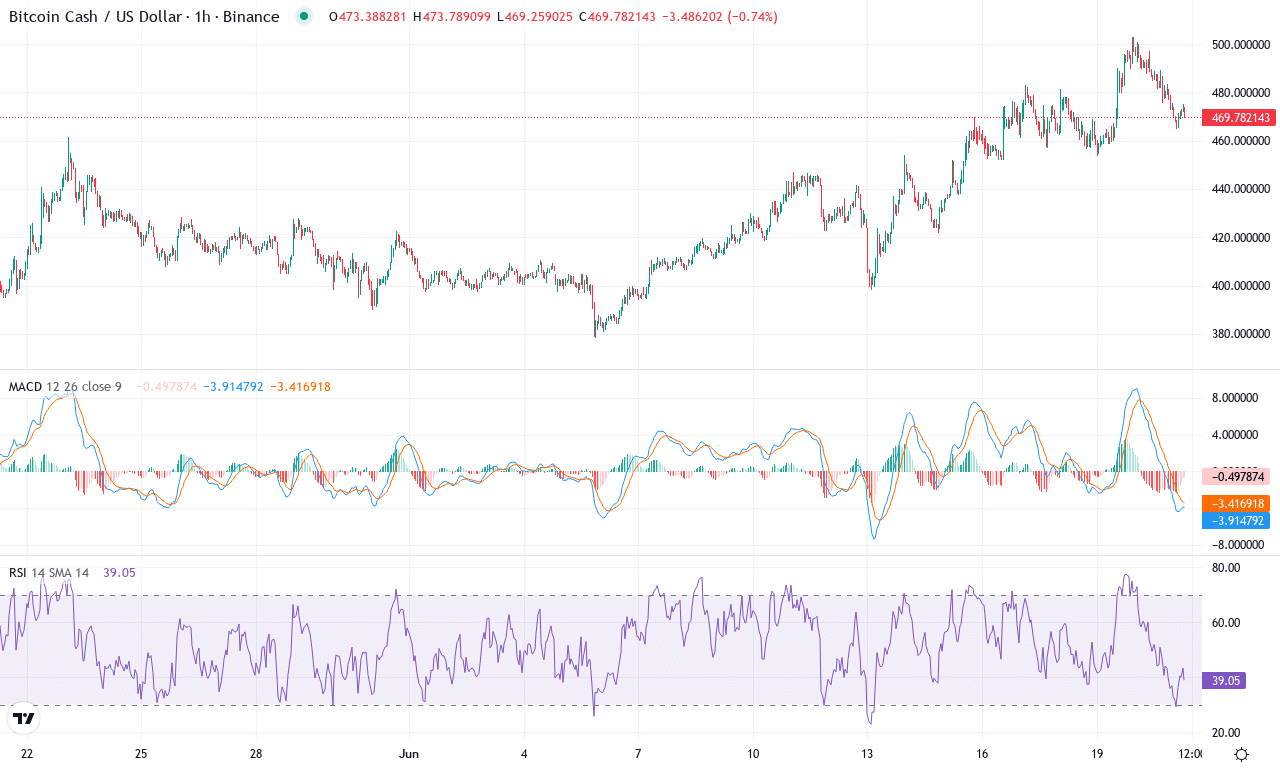
After a robust 15% monthly rally and an eye-popping 46% jump over the last three months, Bitcoin Cash (BCH) has emerged from its protracted sideways slumber with serious breakout momentum. The coin is now trading just below its monthly high at $471, having left its recent lows of $378 in the dust—a clear sign that bulls have retaken the wheel. The past week’s nearly 5% climb adds fuel to the fire, pushing BCH toward resistance levels not seen in months. Institutional demand and renewed altcoin sector interest appear to be stoking the flames, and with volatility on the rise, the next act could get dramatic. As someone watching these charts, I can’t help but feel the excitement brewing—if BCH clears the next hurdle, fireworks seem inevitable.
Technically, BCH is in fighting form: strong trend indicators amplify the bullish case, with the ADX signaling a powerful trend and positive directional movement overshadowing the bears. The weekly MACD shows acceleration, and the main oscillators all point to active buying—resulting in an RSI perched just shy of typical overbought territory. BCH is thriving above its short- and medium-term moving averages, which have begun to fan out, signaling a genuine uptrend. Immediate resistance looms at the $520 zone, a psychological and technical barrier attracting plenty of attention; if bulls manage a close above this region, expect a swift move toward the $630 target. On the flip side, should profit-taking or a broader crypto pullback spark long liquidations, look for a possible retest of key support near $445, with deeper support at $416 acting as a safety net. Right now, all signals suggest the path of least resistance is higher—but as any trader knows, “you’re not in the red until you sell.” Stay nimble and watch the trigger levels closely.
Monero (XMR) Price Analysis
| Crypto | Close | 1W% | 1M% | RSI | ADX | MACD | CCI 20 | MONERO(XMR) | $316.38 | 1.08% | -20.07% | 45.4 | 19.7 | -5.85 | -76.55 |
|---|
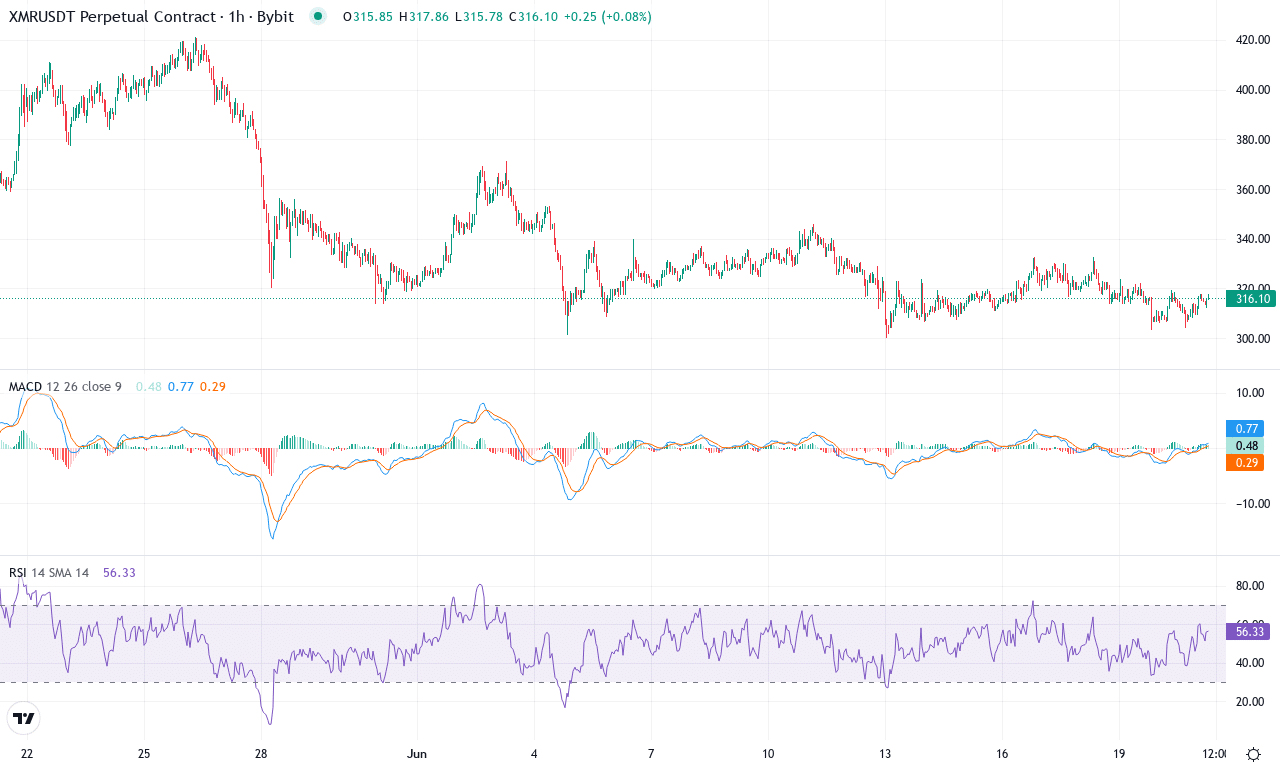
Monero just completed a brutal month, shedding over 20% and snapping its multi-month rally, yet the bigger picture remains compelling. After rocketing nearly 66% over the past six months, this sudden correction feels more like profit-taking than the start of a new downtrend—at least for now. Price action analysis shows XMR holding firm at $316, glued to its 10- and 20-day moving averages after an anxious weekly finish. The recent volatility surge has clearly shaken out late bulls, but seasoned traders know Monero’s deep liquidity and privacy narrative often see a resurgence once bears lose momentum. I’ll be honest: pullbacks like this test conviction, but history favors those who keep focus at key inflection points.
Technically, the setup is finely balanced. Trend indicators reflect a tug of war: the average directional index remains strong, but the negative directional movement has overtaken positives, highlighting growing bearish momentum. The weekly MACD, however, hints at possible acceleration should buyers reemerge, while oscillators signal XMR is approaching oversold territory—an environment that often precedes a sharp reversal. Price is hovering just above a crucial support zone at $312, sitting nearly atop both the 50-day EMA and the classic pivot midpoint. A decisive rebound from here could see Monero targeting resistance levels at $337, and—if momentum truly returns—an assault on the monthly high near $421 isn’t off the table. But, if price slips beneath $290, risks of an extended fall grow sharply, potentially dragging XMR into a steep correction. All eyes on the coming sessions; whichever side controls $312 will dictate Monero’s next act.
Hyperliquid (HYPE) Price Analysis
| Crypto | Close | 1W% | 1M% | RSI | ADX | MACD | CCI 20 | HYPERLIQUID(HYPE) | $34.85 | -17.53% | 23.06% | 46.9 | 32.1 | 1.37 | -89.12 |
|---|
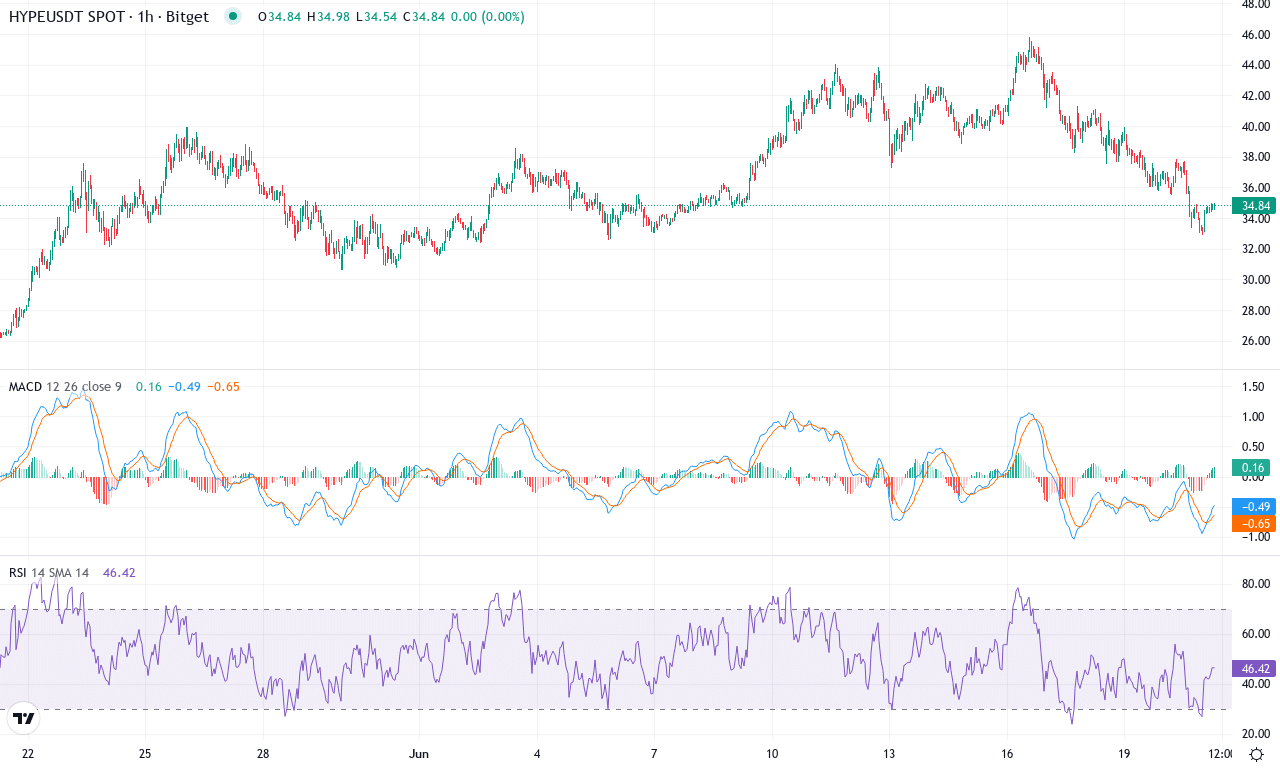
After a stellar 123% run-up over the last three months, Hyperliquid (HYPE) is delivering a volatile retracement, shedding nearly 18% in the last week as traders lock in profits. Despite this sharp correction, the monthly performance remains robust—up 23%—and the broader yearly context paints HYPE as one of the market’s standout performers, still perched well above its long-term moving averages. Price recently tagged a monthly peak near $45.82 but has since slipped back toward the psychological $35.00 handle. The technical outlook suggests that while HYPE’s meteoric ascent has cooled, underlying bullish momentum may not be entirely exhausted just yet. I’m watching for volatility to squeeze out late bulls here; you’re never out until you decide to be.
Trend indicators remain constructive but show signs of fatigue: directional movement signals are closely bunched, and the average directional index signals ebbing trend strength—a typical sign as rallies mature. Notably, the MACD is still in positive territory, but its histogram is contracting, and the gap between the MACD line and signal has narrowed, hinting at potential for a deeper mean reversion if buyers don’t step in soon. Oscillators like RSI have retreated from overbought zones, suggesting the immediate froth has been cleared—yet HYPE continues to hover above key exponential moving averages, signaling resilience. The primary battleground now lies at the former support zone around $35.00; if bulls can defend this level, a bounce back toward $40.00–$42.00 isn’t out of reach. However, a decisive break below $34.00 risks an extended fall toward the next support at $30.60. All eyes on the next move—if volume swells and buyers re-emerge, the uptrend could find fresh legs, but complacency here would be costly.
Will Resistance Hold?
Bitcoin Cash tests major resistance, with its next move possibly defining the bullish trend’s continuation. Monero teeters on support, suggesting an impending decision point that could either stabilize or spur further declines. As Hyperliquid runs the gauntlet of recent gains, traders are alert for signs of a reversal. Each coin faces a critical juncture, with upcoming sessions set to clarify whether bulls retain control.