Bitcoin And Ethereum Bulls Face Make-Or-Break Moment As $111K And $2.8K Barriers Tighten
Bitcoin and Ethereum are on the cusp of pivotal moves, with both cryptocurrencies eyeing critical resistance levels. Bitcoin’s strong uptrend has propelled it just a hair under its recent high, while Ethereum’s momentum hints at a potential breakout after testing its monthly resistance. The next phase for both assets is a make-or-break moment — will they surge past these barriers or falter under pressure? Let’s take a closer look at the signals behind the move.
Bitcoin (BTC) Price Analysis
| Crypto | Close | 1W% | 1M% | RSI | ADX | MACD | CCI 20 |
|---|---|---|---|---|---|---|---|
| BITCOIN (BTC) | $105984.66 | 1.14% | 2.79% | 54.6 | 20.7 | 787.53 | -30.59 |
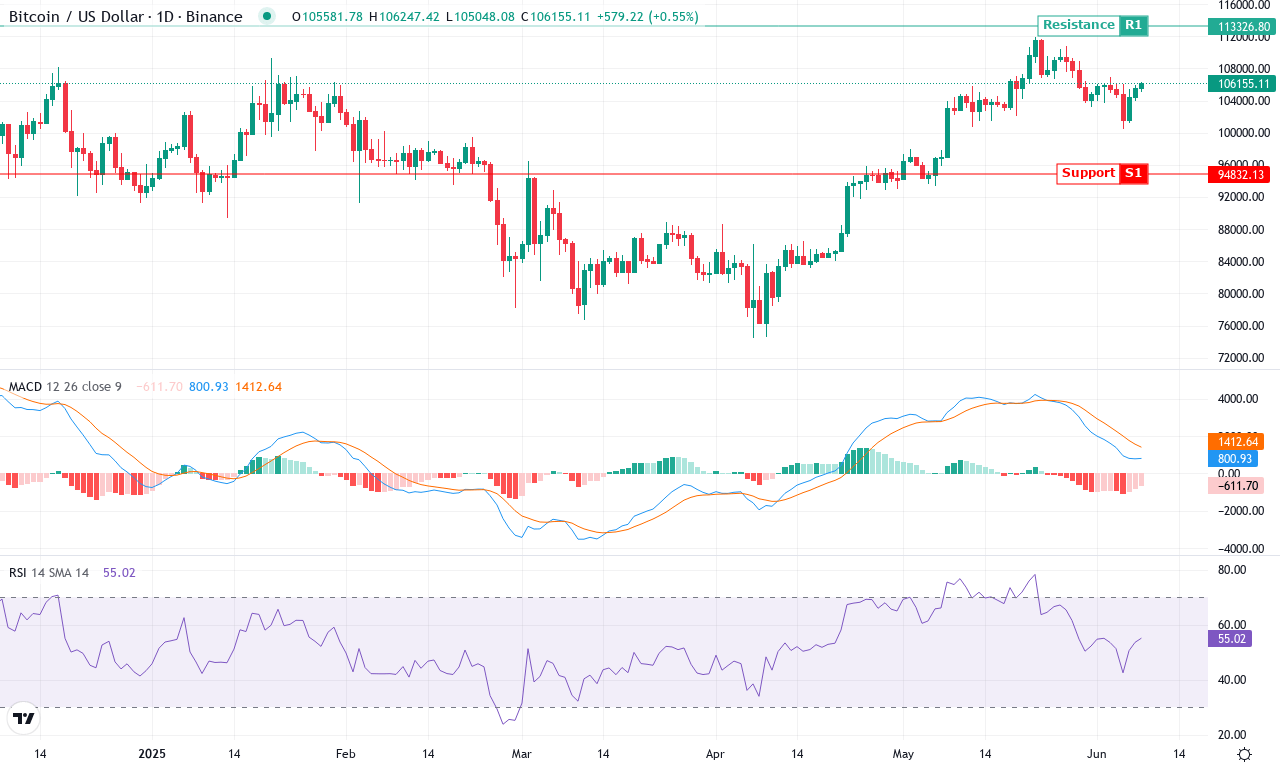
After a month of tepid but persistent grind higher, Bitcoin is showing steely breakout momentum. Fresh off a close above $105,000 and holding decisively at $105,984, BTC is trading just shy of its monthly peak. Bulls have remained firmly in control, notching a 2.7% gain in the last month and a towering 31% surge over the past three months—a sign that institutional demand continues to pour fuel on the uptrend. Technical outlook suggests that despite swelling volatility and a few shallow pullbacks, the prevailing trend remains bullish. With yearly gains already above 50%, the market is starting to position for a possible run at new all-time highs, and I’ll admit, if Bitcoin breaks the psychologically pivotal $110,000–$112,000 zone, I’ll be more than thrilled.
Diving into the technicals, trend indicators paint a convincing narrative: the ADX confirms strong trend strength, while momentum oscillators—including a rising weekly MACD—signal buyers are still pushing the pace. The MACD histogram shows renewed bullish acceleration, and the RSI hovers comfortably in bullish territory, steering clear of classic overbought levels. Price action analysis further strengthens the bullish thesis: Bitcoin is trading well above all major moving averages, and the short-term exponential moving averages cluster just below current price, forming a strong support base around $104,000. Key resistance looms near the monthly high at $111,900; if bulls can clear this zone, the next technical target lies near $120,000, where historic resistance and round number psychology may trigger profit-taking. On the flip side, a failed breakout and shift in momentum could trigger a steep correction down to the $101,000–$98,000 support shelf. All signs point to an inflection point—time to keep stops tight, conviction high, and eyes peeled for the next surge.
Ethereum (ETH) Price Analysis
| Crypto | Close | 1W% | 1M% | RSI | ADX | MACD | CCI 20 |
|---|---|---|---|---|---|---|---|
| ETHEREUM (ETH) | $2515.26 | -0.55% | 14.01% | 52.9 | 23.7 | 53.43 | -68.11 |
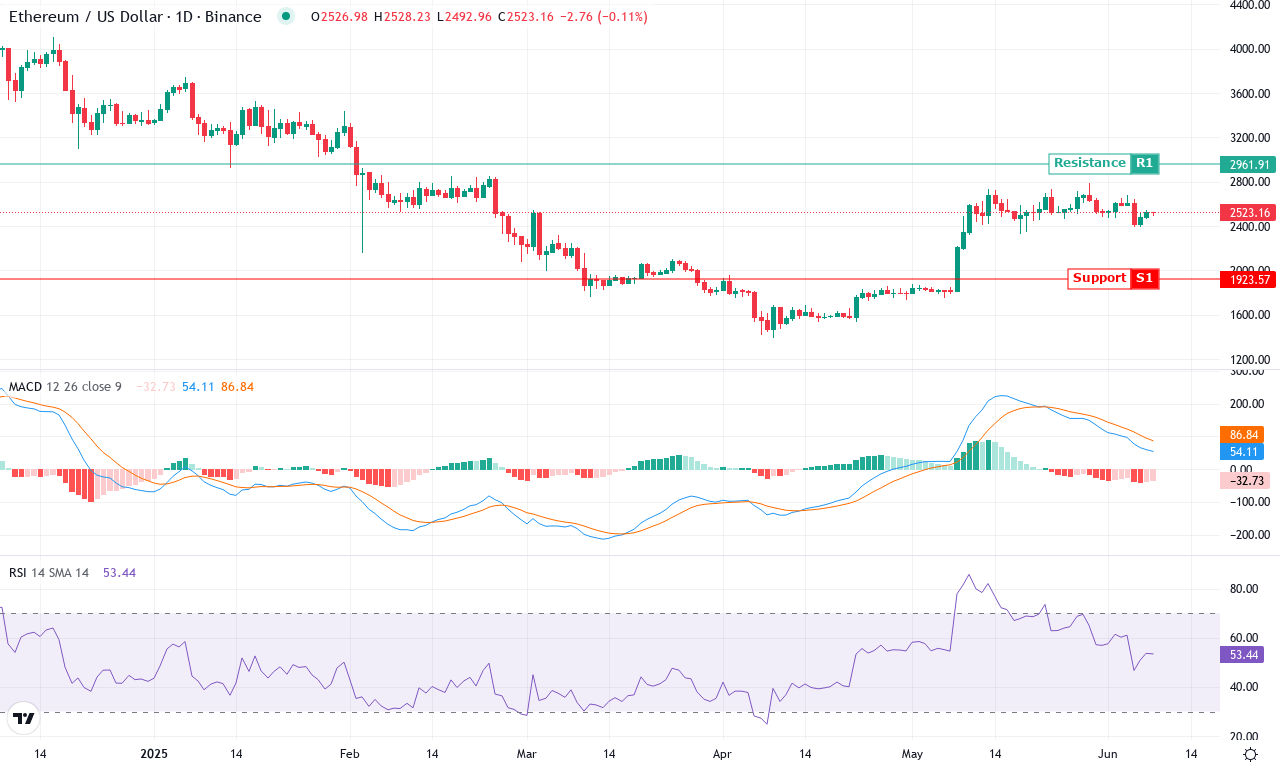
After a month marked by choppy trading and a stellar 14% surge, Ethereum is once again capturing traders’ attention with decisive price action. The bounce off the monthly low near $2,320 set the stage for last week’s retest of highs above $2,790, even as short-term momentum cooled slightly—Ethereum dropped a fraction under 1% over the last week, hinting at a tug-of-war between profit-taking and fresh buyers. Longer-term, however, the backdrop is far less rosy: six-month and yearly performance remain deep in the red after last autumn’s steep correction. That undertone is hard to ignore, but recent strength could be the opening chapter of a larger recovery story. I confess—if ETH can put the $2,800 region decisively behind, I’ll be eager to ride any breakout momentum.
The technical setup reveals a tense equilibrium: trend indicators are perking up, as shown by a robust ADX reading and a narrowing gap between positive and negative directional lines. The weekly MACD, while still negative, is inching toward a bullish crossover, and momentum oscillators are swinging back from prior oversold readings. Typical moving averages, including the 10- and 20-day EMAs, hover just below the current price, lending immediate support in the $2,500–$2,530 zone. However, Ethereum is now butting up against a thick cluster of resistance, both structural (the $2,800 round figure) and technical (the monthly high). If bulls clear this barrier, the path looks open toward $3,000 and possibly even $3,400, where the next major resistance sits. Conversely, failure to sustain upward pressure could trigger a swift pullback to the $2,350 pivot—and risks an extended fall if that fails to hold. The technical outlook suggests volatility is set to surge soon; all eyes on $2,800 for confirmation of Ethereum’s next big move.
Next Moves in a Critical Market Phase
Bitcoin is poised below the $111K mark, holding the potential for an upward surge, though it faces stiff resistance ahead. Ethereum hovers near $2.8K, with a breakout contingent on sustained buying power. Both assets are at a junction; their ability to sustain recent momentum will dictate the path forward. Traders should closely monitor these levels for decisive market cues.