Bitcoin And Ethereum On Edge As Bulls Fend Off Key Support Amid Mounting Pressure
Bitcoin and Ethereum have both posted impressive monthly gains, but key resistance zones now stand in the way. As Bitcoin slips nearly 7% for the week and Ethereum faces a similar reversal, traders are bracing for a possible turning point. Will bullish strength continue or give way to short-term exhaustion? Let’s break down the technical setup across the board.
Bitcoin (BTC) Price Analysis
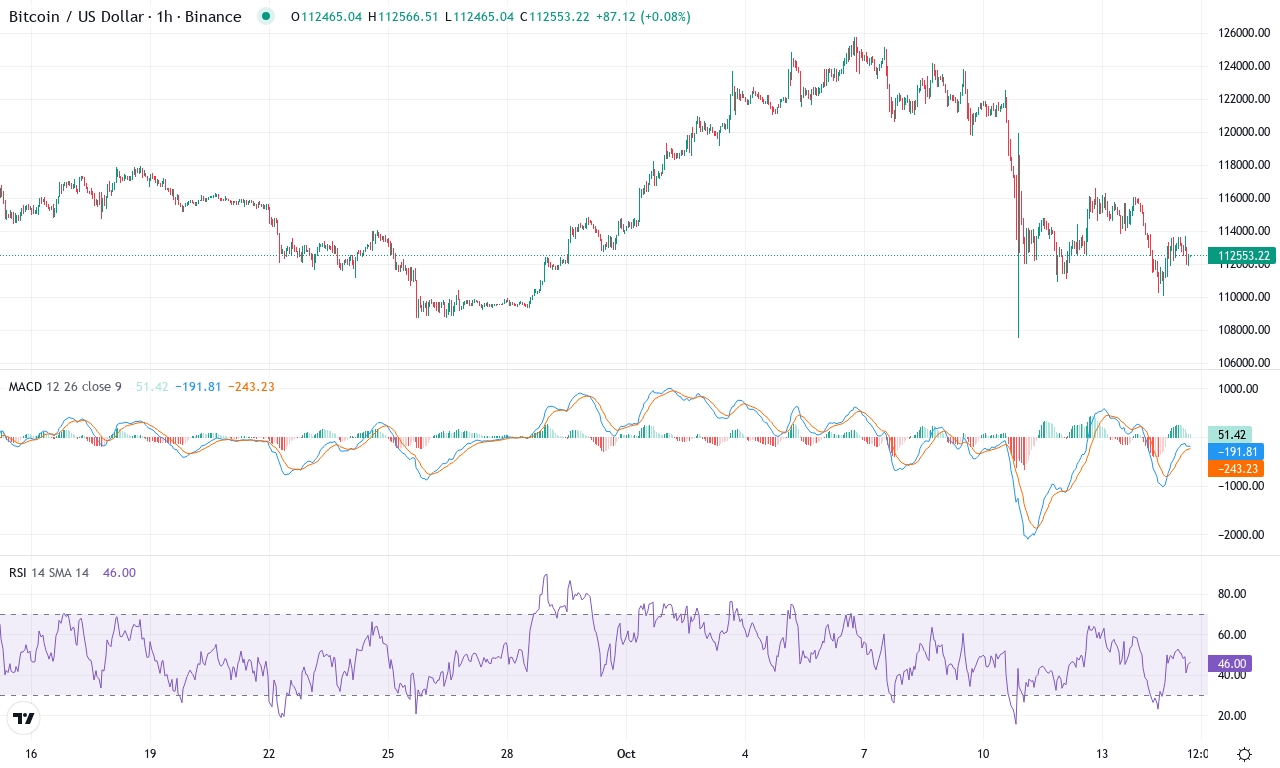
| Crypto | Close | 1W% | 1M% | RSI | ADX | MACD | CCI 20 | BITCOIN(BTC) | $112450.78 | -7.35% | -2.49% | 42.0 | 28.8 | -146.63 | -62.23 |
|---|
After a sizzling first half of the year, Bitcoin has hit a pronounced patch of turbulence, slipping nearly 7% in the last week and sliding back by roughly 2.5% for the month. This recent volatility comes after months of powerful gains, with Bitcoin still up an impressive 70% year-over-year. However, the prevailing mood among traders has shifted; after marching toward all-time highs, Bitcoin now finds itself wrestling for direction just above $112,000—well below its monthly high, and barely clinging to psychological support. The technical outlook suggests a market at a crossroads, with short-term momentum bruised, but the broader macro trend not entirely broken. Honestly, it’s a tense spot: the energy feels coiled, like the market is bracing for a decisive next move.
Technically, trend indicators highlight some real fragility: ADX is elevated, but negative directional signals have surged, underlining persistent bearish pressure and flagging risks of an extended fall. The MACD has flipped sharply lower on most timeframes, and momentum oscillators are calling out exhaustion—RSI hovers near the midline, stripping away the relentless optimism of previous months. Price action has decisively cut under key exponential moving averages, with Bitcoin consolidating just above crucial support around $108,000. Any slip below this level opens the door to a steeper correction, perhaps testing the $102,000 region, while upside ambition will be capped by the next resistance at $118,900. If bulls can reclaim $119,000, the path toward fresh highs would clear rapidly—but, frankly, the chart feels heavy. Watch for liquidity-driven whipsaws and beware of forced liquidations; in these foggy conditions, discipline trumps bravado.
Ethereum (ETH) Price Analysis
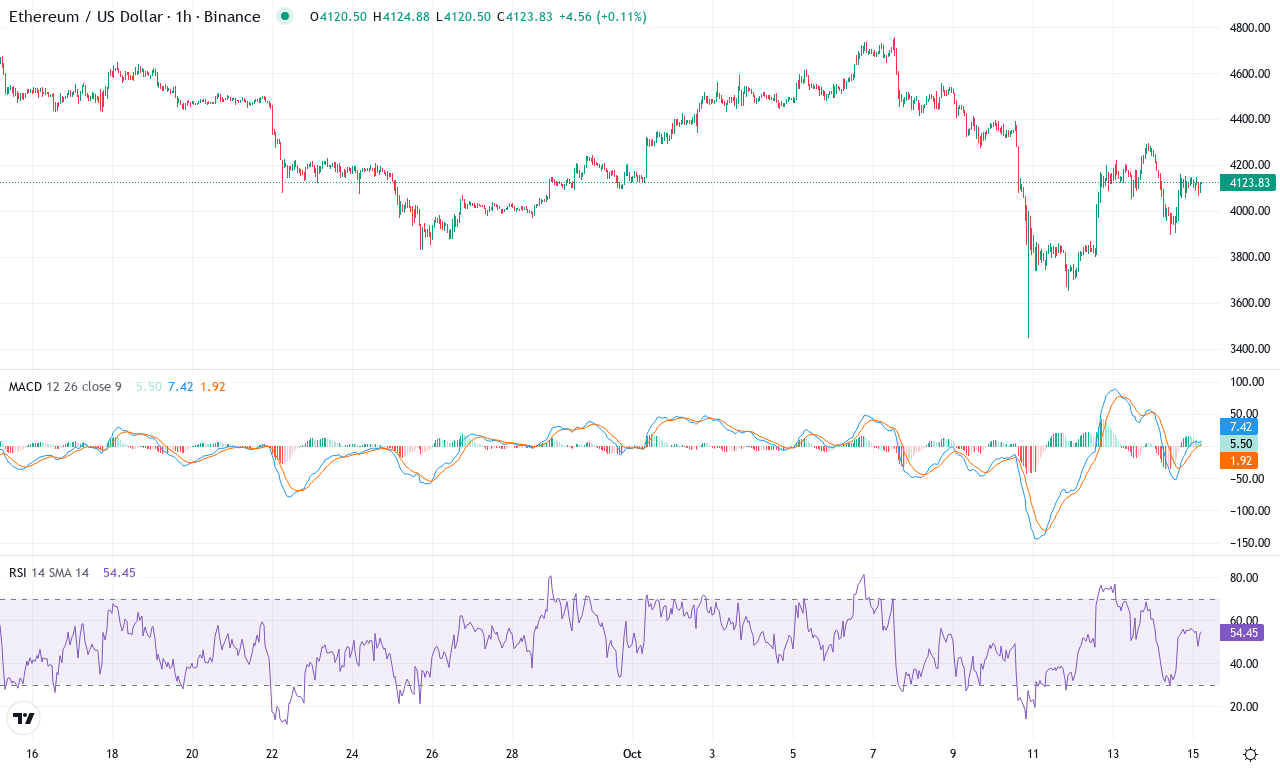
| Crypto | Close | 1W% | 1M% | RSI | ADX | MACD | CCI 20 | ETHEREUM(ETH) | $4117.55 | -7.49% | -10.62% | 45.8 | 20.8 | -60.60 | -41.42 |
|---|
After a blistering 22% rally over the past three months, Ethereum has run into a sharp headwind. In just the last week, ETH has reversed course, sliding nearly 7.5% and erasing much of July’s bullish momentum. The reversal hasn’t surprised attentive traders—after a sustained runup of almost 160% in six months, profit-taking was inevitable. Currently, Ethereum trades just above $4,100, well below the month’s high near $4,750, as nervous sellers test key support. While I’m not thrilled to see this kind of drawdown, it’s a crucial stress test for bulls: ETH is hovering around its 50-day and 100-day averages, both essential battlegrounds for technical sentiment and institutional flows alike.
Technically, storm clouds are gathering. The average directional index points to a robust but potentially waning trend, while negative directional pressure outpaces positive—sellers are gaining traction. The weekly MACD shows clear deceleration, and major oscillators including RSI have dipped but haven’t yet breached oversold territory, suggesting there’s room for more downside before capitulation. Price action analysis puts ETH squarely at a make-or-break juncture: the immediate support around $3,700 looms large; if sellers drag it below, risks extend toward the $3,300 zone and even $2,400 if a steep correction takes hold. On the flip side, should bulls engineer a bounce here and break resistance near $4,250, renewed momentum could target $4,650 and beyond. Right now, the path of least resistance is lower—unless buying volume surges and bearish momentum fades quickly, caution is warranted. As always, you’re not in the red until you sell—but pyramiding into weakness rarely ends well.
Will Bulls Hold the Line?
Bitcoin is testing its $27,000 support, while Ethereum eyes $1,900, both at risk of further declines if pressure persists. A successful defense could spark renewed buying interest, but failure may invite deeper corrections. Traders remain cautious, watching for signs of either bounce or breakdown in the sessions ahead.