Bitcoin, Bitcoin Cash, and Ethereum Test Critical Junctures as Bulls Eye Breakouts but Reversal Threat Looms
As Bitcoin, Bitcoin Cash, and Ethereum jockey for position in a dynamic market, recent movements suggest the crypto scene is poised for potentially significant shifts. With Bitcoin posting nearly 2% gains this month, it faces a crucial resistance test just above $111,900, echoing a broader bullish thrust driven by institutional appetite. Meanwhile, Bitcoin Cash’s double-digit growth hints at a possible breakout, nearing the pivotal $460 level, but hovering risks still loom large. Ethereum, however, is treading on thin ice, with mixed signals casting doubt on sustaining upward momentum. Let’s delve into the charts to assess these pivotal moments and uncover what lies ahead.
Bitcoin (BTC) Price Analysis
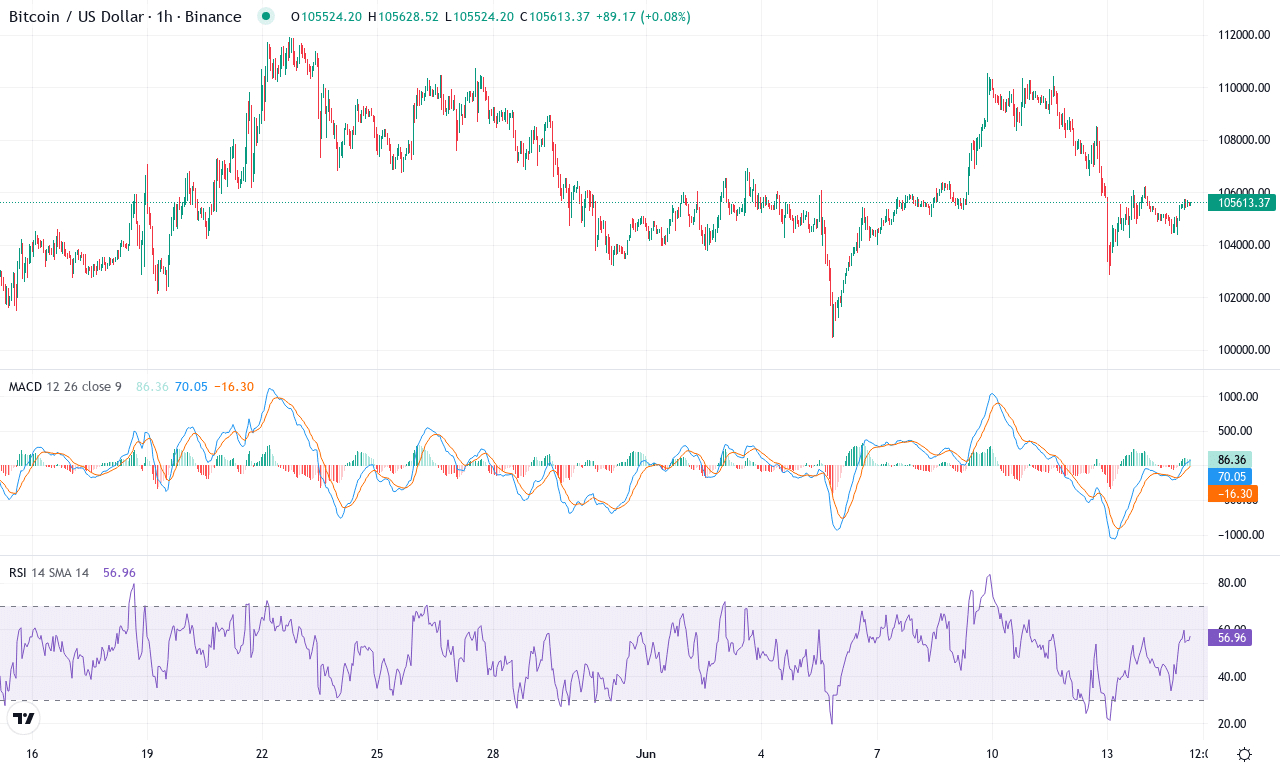
| Crypto | Close | 1W% | 1M% | RSI | ADX | MACD | CCI 20 | BITCOIN(BTC) | $105613.31 | 0.03% | 1.72% | 50.3 | 18.2 | 761.98 | -22.33 |
|---|
After a month of healthy gains and a steady push off the recent dip, Bitcoin is back in the spotlight, up almost 2% this month and sitting just above $105K. While the king of crypto lagged broader risk assets recently, traders can’t ignore BTC’s strong three-month surge of nearly 28%. This rally has unfolded against the backdrop of waning bearish sentiment and mounting institutional demand—a critical driver as we head into the summer stretch. Enthusiasm is starting to build again, with Bitcoin’s close price nudging last week’s mark, and all eyes are now fixed on the pivotal $111,900 resistance from last month’s high. If BTC clears that level, it could reignite breakout momentum and put the $120K region in sharp focus. Frankly, if we get that kind of move, I wouldn’t be surprised to see long liquidations amplify the rally in dramatic fashion.
Diving into the technicals, trend indicators support the bullish stance: the average directional index shows trend strength holding steady, and positive momentum is sitting comfortably above the negative. The weekly MACD is turning up, reinforcing the underlying bullish momentum, though short-term oscillators now hover close to overbought territory—RSI is just above 63, suggesting bulls are in control but may be running a bit hot. Most moving averages, including the 50- and 100-day EMAs, are stacked beneath current price action, forming a platform of support near $98,500. That’s the level to defend if sellers show up; a failure there risks extended falls toward $94,800. On the flip side, should BTC punch through $112K, the path looks open toward $121,800 and possibly the psychological $140K handle—where I’d happily celebrate with the rest of the hodlers. For now, the technical outlook suggests bulls have the upper hand, but traders need to be nimble: a close below $98,500 would invalidate the breakout thesis and herald a potential correction.
Bitcoin Cash (BCH) Price Analysis
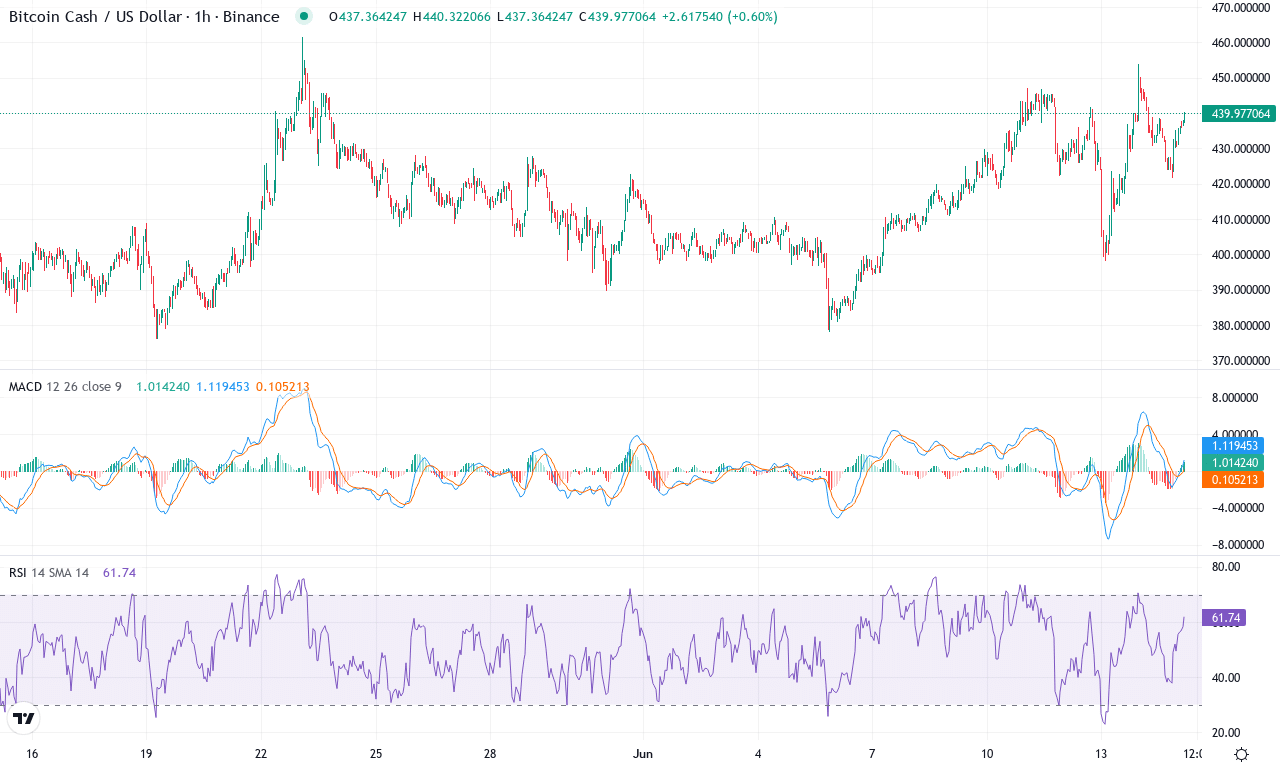
| Crypto | Close | 1W% | 1M% | RSI | ADX | MACD | CCI 20 | BITCOIN CASH(BCH) | $440.18 | 7.39% | 11.11% | 58.9 | 18.6 | 9.88 | 119.72 |
|---|
After a month of solid upward momentum, Bitcoin Cash is capturing attention with double-digit gains—up over 11% this month and nearly 32% in the last quarter. Bulls seem to be regaining control following a prolonged pullback over the spring, pushing prices close to the major psychological level of $450. The recent 7% rally this week hints that buyers are stepping in aggressively, especially as BCH carves out higher lows above its monthly support near $380. This tightening price action isn’t going unnoticed—if the current surge holds, we could be on the verge of a renewed breakout phase, with volatility ticking higher just as trend indicators start signaling fresh acceleration.
Diving deeper, the technical outlook suggests bullish momentum is building. The primary trend indicator is printing well above average, and the gap between positive and negative directional readings continues to widen—classic signals of trend strength. The MACD line is accelerating ahead of its signal line for both weekly and daily frames, with momentum oscillators flipping firmly positive. Notably, RSI lingers in the high fifties, telling us there’s plenty of room before overbought conditions take hold. Price holds well above most key moving averages, putting $460 in the crosshairs as the next resistance—if bulls clear that, the path opens up toward $520, last seen during previous rally peaks. On the flip side, should sellers wrestle back control, watch for a pullback toward $410 where both moving average and pivot support converge. Personally, I’d be thrilled to see sustained strength—we don’t often get this kind of setup in a mixed market. Just don’t get caught chasing if momentum stalls at resistance—the next few sessions could get wild.
Ethereum (ETH) Price Analysis
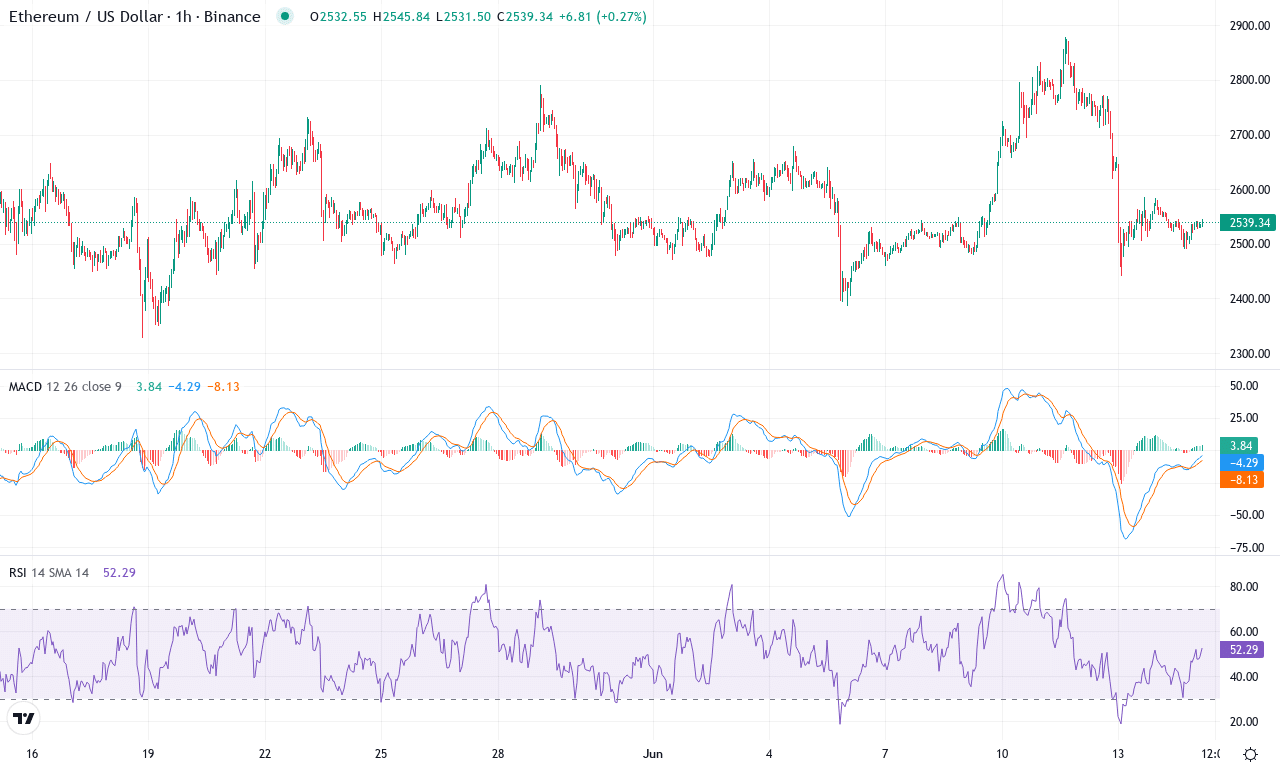
| Crypto | Close | 1W% | 1M% | RSI | ADX | MACD | CCI 20 | ETHEREUM(ETH) | $2544.75 | 0.70% | -0.14% | 50.2 | 20.1 | 49.78 | -47.83 |
|---|
After a month marked by hesitation and choppy price action, Ethereum is struggling to reclaim its footing, closing the week at $2,544.75—near the lower end of its recent trading range. Short-term momentum has all but stalled, with a meager 0.7% gain over the past week and an unimpressive monthly decline, reflecting a clear drop in bullish conviction. The broader trend remains muddled; while the three-month view still shows impressive gains, that strength has bled away since the start of spring. Right now, traders seem torn between the lingering optimism from Q1’s rally and growing anxiety about another steep correction. If Ethereum can’t defend key support levels soon, risks of an extended fall remain on the table.
Technically, the outlook suggests further caution. Trend indicators are flattening out, showing that bulls have lost their grip, while the weekly MACD, after months of acceleration, is now faltering dramatically—a sign that the rally phase is over for now. With RSI slipping below neutral and oscillators pointing to fading momentum, there’s not much gasoline left for a sustained run higher. Ethereum’s price is drifting well below its short-term EMAs and is hovering dangerously close to a crucial support zone near $2,350; if that fails, expect sellers to target the next psychological level at $2,000. On the upside, a strong close above resistance at $2,875 would invalidate this bearish thesis and spark hopes for renewed upside momentum. But for now, it feels like patience is a trader’s best friend—don’t get caught fighting the tape in a market that lacks conviction.
Will New Highs Emerge?
Bitcoin currently tests a key resistance, with its ability to surpass $111,900 crucial for sustained upward momentum. Bitcoin Cash needs to decisively break through $460 for a confirmed continuation of its rally. Ethereum faces uncertainty, as it contends with mixed signals that may impede its ascent. The upcoming sessions are crucial for determining whether bulls can seize control or if reversals are on the horizon.