Bitcoin Bulls Eye $121,800 as Ethereum Rallies Toward $3,000—Is Breakout Momentum About to Explode or Fade?
Bitcoin and Ethereum have both posted impressive monthly gains, but key resistance zones now stand in the way. With Bitcoin pressing against its recent high near $112,000, traders watch for momentum to steer it past crucial $121,800 levels.
Bitcoin (BTC) Price Analysis
| Crypto | Close | 1W% | 1M% | RSI | ADX | MACD | CCI 20 |
|---|---|---|---|---|---|---|---|
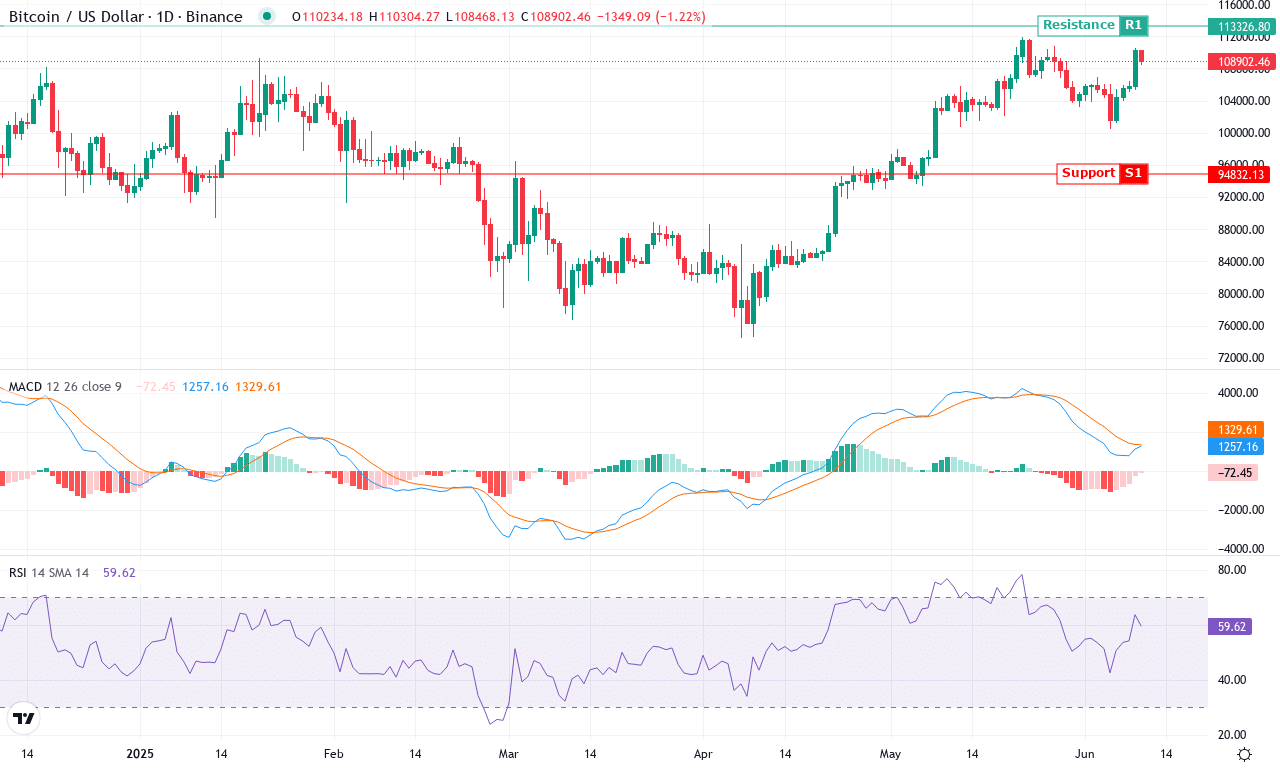
| BITCOIN (BTC) | $108823.61 | 2.84% | 4.12% | 59.7 | 19.4 | 1258.38 | 88.11 |
After a month of steady gains that propelled Bitcoin up over 4%, the world’s bellwether cryptocurrency is pressing against new highs, barely flinching amid persistent volatility. Bitcoin’s remarkable three-month surge north of 31% has traders glued to their screens, watching for breakout confirmation. The macro trend unmistakably favors the bulls: six-month and twelve-month performance metrics shine, and the price sits well above all major moving averages. Having just touched a monthly high near $112,000 and holding support above $100,000, Bitcoin feels primed for a shot at its all-time highs—a psychological battlefield where both traders’ nerves and order books are getting tested. Personally, if this momentum carries Bitcoin past $120,000, I probably won’t be the only one excited for a potential parabolic run.
Diving deeper, technical signals offer fuel for this optimism. Trend indicators remain robust: the extended rally is underpinned by strong directional movement, and the weekly MACD shows sustained acceleration with its histogram building steadily. Oscillators have cooled slightly from technically overbought readings, but neither RSI nor the Ultimate Oscillator show outright exhaustion just yet—they are merely hinting that things may be a touch frothy. Price action narrative is bullish: Bitcoin continues trading north of its 10- and 20-period EMAs, reinforcing short-term support around $106,000, while major resistance looms at $121,800 and $140,000. If bulls can muscle through $121,800, a swift rally toward $140,000 isn’t out of the question; conversely, failure to hold $106,000 opens the door for a sharper correction toward mid-$90,000s. As ever, rising open interest and occasional profit-taking spikes inject suspense—if you’re feeling the adrenaline, you’re not alone here. All told, Bitcoin’s technical outlook suggests the breakout momentum isn’t spent just yet, but traders should keep their stops tight—volatility could spark a rude awakening for late longs if key support gives way.
Likewise, Ethereum’s 6% monthly climb brings it tantalizingly close to testing $2,800, leaving traders to ponder if the rally will press onward. Will bullish strength continue, or will we see short-term exhaustion take hold? Let’s break down the technical setup.
Ethereum (ETH) Price Analysis
| Crypto | Close | 1W% | 1M% | RSI | ADX | MACD | CCI 20 |
|---|---|---|---|---|---|---|---|
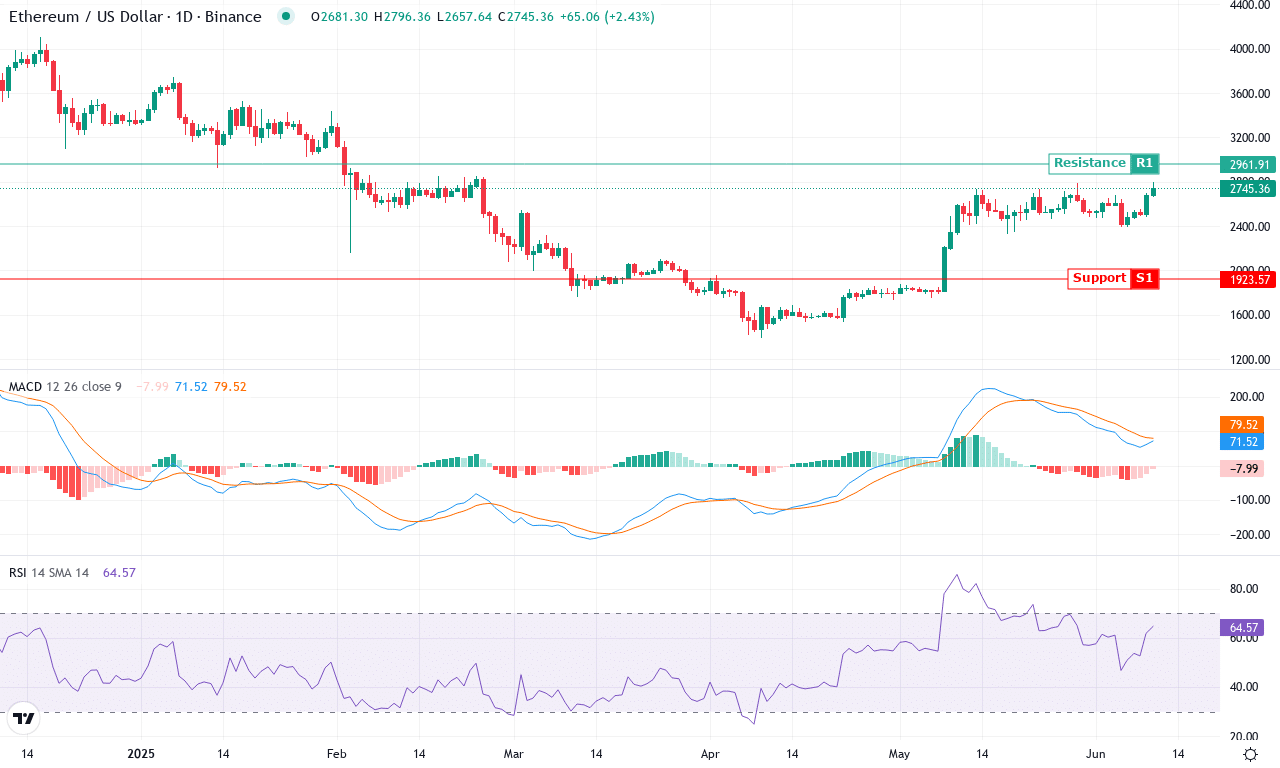
| ETHEREUM (ETH) | $2742.25 | 5.22% | 6.30% | 64.4 | 24.1 | 71.20 | 178.29 |
After a choppy month marked by whipsaw volatility, Ethereum is making a convincing push higher, up over 6% on the month and carving out a fresh monthly high around $2,796. The macro backdrop is complicated—Ethereum’s six-month and yearly performances remain negative and deep in the red—but the last three months have brought an impressive 42% gain, signaling that the bulls are finally clawing back control. With ETH currently trading at $2,742, price action is hovering just below a major resistance band, while several short-term indicators flash renewed optimism. It’s hard not to feel some excitement here: when a beaten-down blue chip starts showing sustainable upside, you can practically feel the fear of missing out in the market’s heartbeat.
Technical analysis reveals that trend indicators continue to strengthen this week, with the average directional index registering healthy trend strength and the positive trend components overwhelming their bearish counterparts. The MACD line has surged above its signal, highlighting accelerating bullish momentum, while oscillators like the awesome oscillator and CCI have bounced back from lows, suggesting underlying conviction in the rally. Ethereum is trading comfortably above its short-term and mid-term moving averages, which now flatten out as support from $2,550 to $2,590—critical levels that, if lost, could trigger a steep correction back toward $2,350. On the upside, $2,800 stands out as the immediate test; if bulls can crack this level, a rush toward the psychological $3,000 barrier becomes likely. However, RSI is flirting with overbought territory, so a sharp pullback or profit-taking surge wouldn’t surprise me. For now, all signs point to breakout momentum—but keep your stops tight; when crowd enthusiasm peaks, so does downside risk.
Bullish Breakout or Brief Pause?
Bitcoin approaches the pivotal $121,800 level, with its recent surge testing resistance strength. If it powers through, the next bullish objective comes into focus, otherwise a retracement could be on the horizon. Meanwhile, Ethereum’s approach to the $2,800 mark raises similar questions of sustainability. As both cryptos hover near critical zones, traders should closely monitor momentum and volume cues to gauge if this is a stepping stone for further gains or a signal for a breather.