Bitcoin Bulls Eye Breakout as Bitcoin Cash Reawakens—Will Resistance Give Way?
Bitcoin has surged nearly 37% over the past three months, putting bullish traders in the driver’s seat as it flirts with all-time highs just below $108,000. However, with key resistance sitting ominously at $112,000, the path forward seems fraught with tension. Will the bulls muster the strength to break past these barriers, or are we staring at the verge of a temporary cooldown? Let’s take a closer look at the signals behind the move.
Bitcoin (BTC) Price Analysis
| METRIC | VALUE |
|---|---|
| CRYPTO | BITCOIN (BTC) |
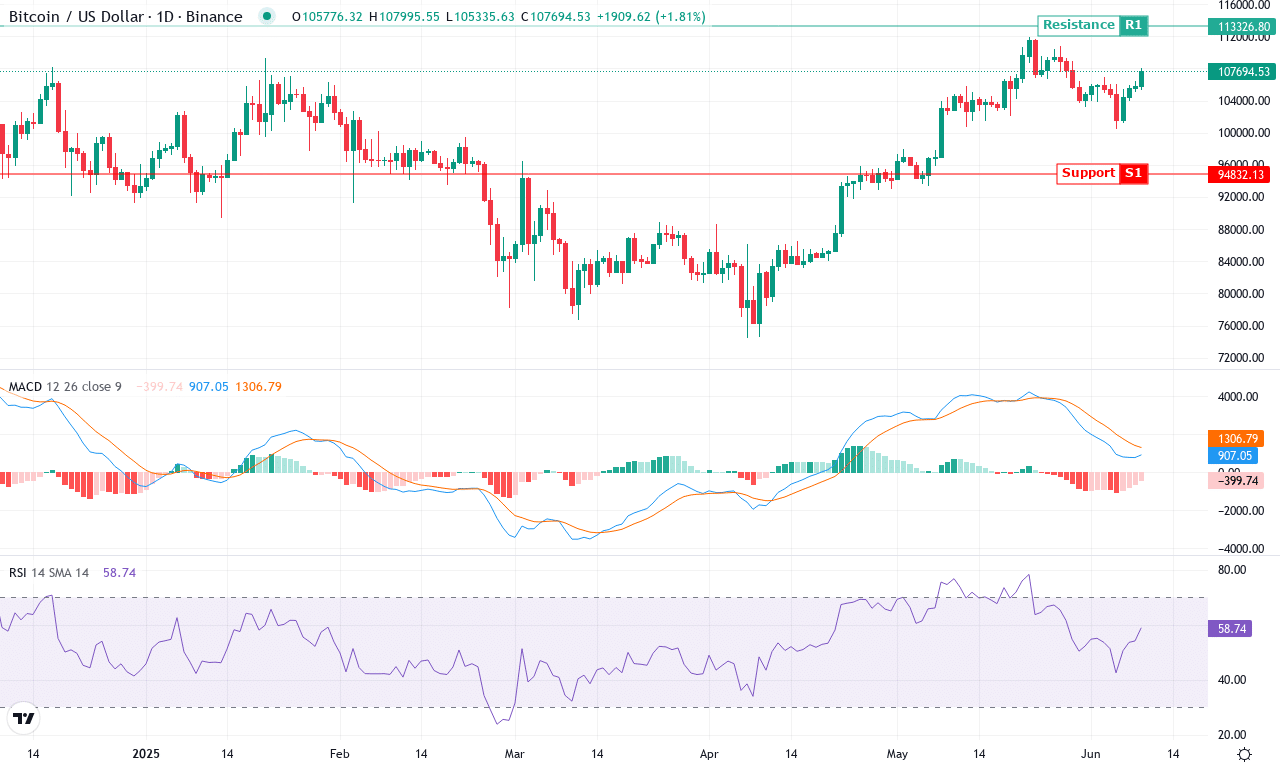
| CLOSE PRICE | $107772.75 |
| 1 WEEK PERFORMANCE | 1.86% |
| 1 MONTH PERFORMANCE | 4.78% |
| RSI | 58.9 |
| ADX | 19.3 |
| MACD | 913.23 |
| CCI 20 | 12.91 |
After a robust three-month rally that sent Bitcoin surging nearly 37%, the world’s leading cryptocurrency is holding its ground just below all-time highs, with the latest monthly close at $107,773. The price action has been anything but dull: After a modest 1.86% uptick this week atop a 4.78% gain for June and a blistering 55% run over the past year, Bitcoin remains the ultimate barometer for risk appetite and institutional inflows. Bulls are flexing amid the volatility, securing higher lows above $100,400—the monthly low—and keeping sellers on their heels. The technical outlook suggests the uptrend isn’t over, but bullish momentum faces a fierce test at nearby resistance around $112,000. If BTC breaks above this level with conviction, I’d be thrilled—it would almost surely spark a fresh wave of long interest, with psychological targets pegged near $120,000 and $140,000.
Drilling into the technicals, trend indicators stay firmly supportive: ADX readings indicate trend strength is robust, while the positive DI continues to outpace its negative counterpart—classic signs of trend-following bulls regaining control. The weekly MACD shows accelerating upward momentum, confirmed by a healthy gap above its signal line. Oscillators and momentum studies reinforce the picture: RSI is hovering in bullish but not severely overbought territory, leaving room for an upside push before exhaustion sets in. Price is comfortably trading above all major moving averages, including the 10-, 50-, and 200-day EMAs, pointing to a secure foundation if sellers attempt a reversal. Immediate support lurks in the $103,000–$101,600 band; if profit booking or a volatility surge sparks a steep correction, expect buyers to defend these zones aggressively. However, a close below $100,400 would risk an extended fall and invalidate the bullish thesis—watch for rapid volatility if that floor cracks. For now, all signs point to breakout momentum, but as always, keep stops tight and manage risk—Bitcoin rarely moves quietly for long.
Meanwhile, Bitcoin Cash is re-emerging with fresh momentum, riding a recent 4% weekly gain that breathes life into its post-spring slump. As resistance looms at $468, the question remains: Will BCH replicate its stellar runs, or will it fizzle out amid broader market fluctuations? Here’s what the key indicators are suggesting now.
Bitcoin Cash (BCH) Price Analysis
| Crypto | Close | 1W% | 1M% | RSI | ADX | MACD | CCI 20 |
|---|---|---|---|---|---|---|---|
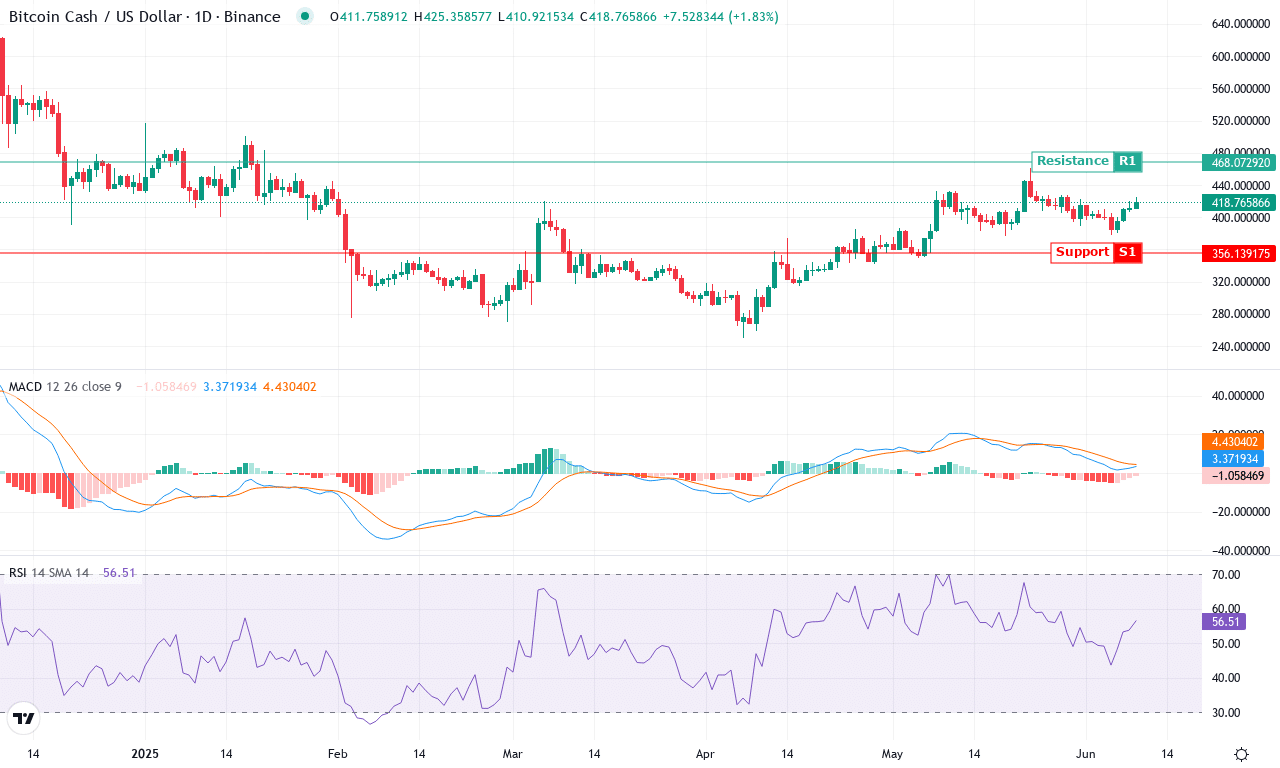
| BITCOIN CASH (BCH) | $419.67 | 4.05% | 1.45% | 56.8 | 19.5 | 3.45 | 48.43 |
After a month defined by choppy price action and muted returns, Bitcoin Cash is emerging from the shadows with a flicker of renewed momentum. Despite eking out just over a 1% monthly gain, the coin’s 4% rally this week stands out against a backdrop of broader altcoin stagnation. Traders remember the early spring fireworks, and with BCH still up over 26% in the past three months—even after a bruising 19% six-month drawdown—there’s an argument to be made for resilience. The price currently hovers near $420, having rebounded strongly off the monthly low set around $376. As volatility stirs, all eyes turn to whether bulls can muster enough strength to challenge resistance at $468, which capped last month’s rally and coincides with a cluster of moving averages.
Technically, Bitcoin Cash is at a crossroads—trend indicators like the weekly MACD have ticked up, hinting at an early-stage reversal, while a robust ADX reading confirms that trend strength is building. Short-term oscillators and a rising RSI paint a picture of swelling bullish momentum, but with the RSI flirting with neutral territory, we’re not yet in overheated territory. Price action analysis shows BCH reclaiming both its 10-day and 20-day exponential moving averages, and the price sits just above the volume-weighted and Hull moving averages—a promising sign for trend-followers. With clear support forming at the $408 pivot region, scenario planning becomes key: if bulls clear resistance at $468, the next technical target lies just north of $520, possibly triggering a short squeeze. If profit-taking intensifies or broader market risk-off sentiment returns, expect a pullback to $380–$390—hardly catastrophic, but enough to shake out weak hands. I’ll be closely watching for a decisive breakout; should BCH explode past $470, there’s plenty of open air above.
Charting the Next Moves
Bitcoin is within striking distance of a significant breakout if it can surpass resistance at $112,000, potentially setting the stage for fresh all-time highs. Meanwhile, Bitcoin Cash shows newfound vitality, but must clear $468 to confirm a sustainable uptrend. While risks of consolidation persist, traders should watch for decisive moves or falteries at these levels to gauge the market’s next pivotal step.