
Bitcoin, Ethereum, and BNB Hover at Make-or-Break Pivots as Bulls Face Mounting Downside Threats
Bitcoin, Ethereum, and BNB are teetering at critical junctures after a volatile month that saw previously steady gains give way to heightened pressure. Bitcoin has pulled back just under key resistance after a vigorous rally, while Ethereum is flirting with monthly lows amid persistent bearish pressure. Meanwhile, BNB’s struggle below major moving averages signals a decisive showdown is imminent. As these leading cryptocurrencies hover at pivotal technical levels, traders face a pressing question: are we poised for a renewed bullish breakout, or is deeper correction on the horizon? Let’s break down the signals suggesting the next directional move.
Bitcoin (BTC) Price Analysis
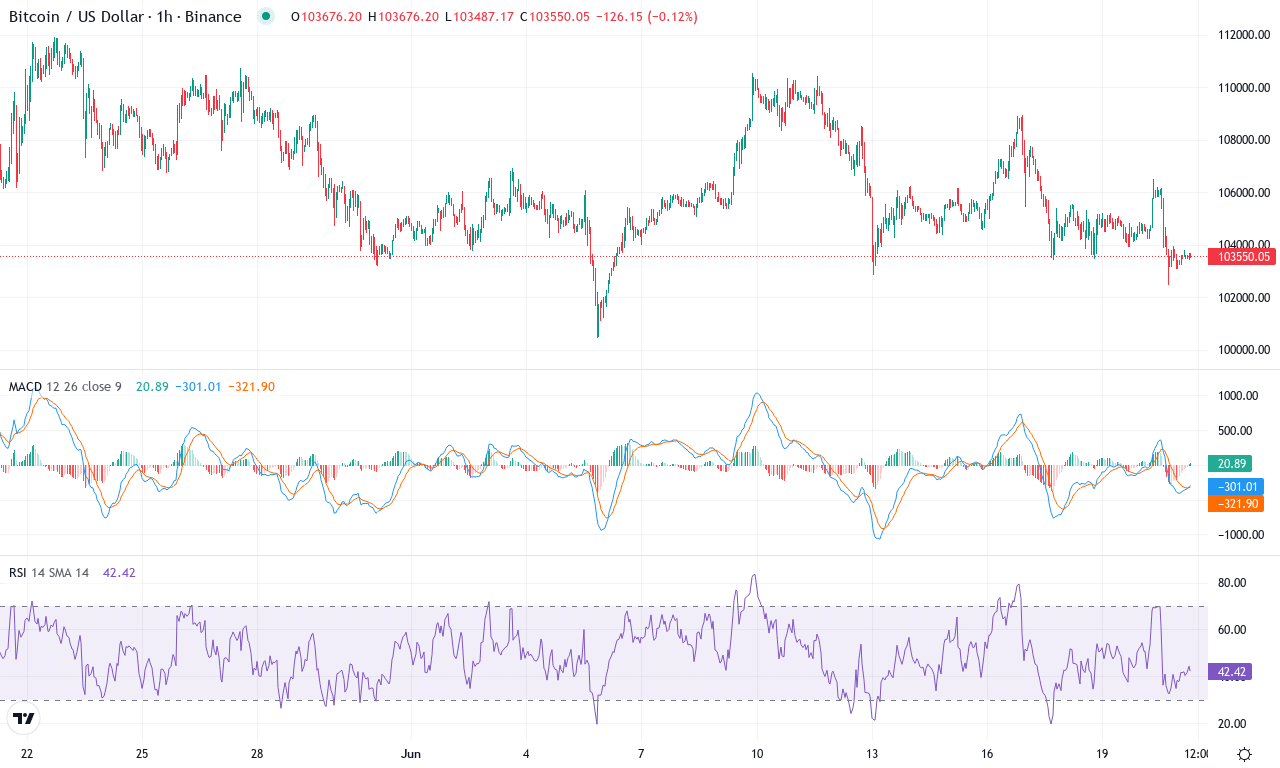
| Crypto | Close | 1W% | 1M% | RSI | ADX | MACD | CCI 20 | BITCOIN(BTC) | $103572.51 | -2.39% | -5.50% | 44.7 | 15.8 | -102.41 | -104.66 |
|---|
After a meteoric Q1 rally, Bitcoin has entered a choppy retracement phase, shedding more than 5% over the past month and dipping below recent highs near $111,700. The action comes amid a cocktail of profit booking, macro uncertainty, and turbulent risk sentiment, which has kept price bottled up between the $100,400 monthly low and key resistance at $113,300. Despite a steep correction from the exuberant year-to-date advance—nearly 60% higher over twelve months—Bitcoin remains perched atop long-term moving averages. But with short-term momentum wavering and traders on edge, volatility is pulsing beneath the surface. If Bitcoin can reclaim ground above $106,000, the technical outlook suggests a return of bullish momentum; fail, and the risks of an extended fall toward the $95,000–$95,800 support zone grow acute. I’m watching these battle lines closely—where the next decisive move breaks, emotion will follow price.
Trend indicators show the uptrend is losing conviction on weekly and daily timeframes. The ADX, while still marking a reasonably strong trend, now reflects a narrowing gap between positive and negative directional lines—evidence that neither bulls nor bears have a decisive edge. The weekly MACD has flipped from acceleration to a plateau, with histogram momentum easing, signaling waning buyer conviction but not quite a bear reversal yet. RSI and oscillators have retreated from overbought extremes but hold neutral, highlighting a market in pause rather than collapse. With price hovering just under the 10- and 20-day exponential moving averages and the classic pivot midpoint near $103,375, Bitcoin teeters at a technical fulcrum. If bulls manage to orchestrate a close above the $106,000 pivot and invalidate the minor downtrend, we could quickly see a retest of $113,300 resistance and possibly even fireworks toward the psychological $120,000 level. Conversely, a breakdown below $100,400 could trigger a wave of long liquidations and open the door to a deeper slide into the $95,000 range. For now, the path is murky—stay nimble and watch those pivots.
Ethereum (ETH) Price Analysis
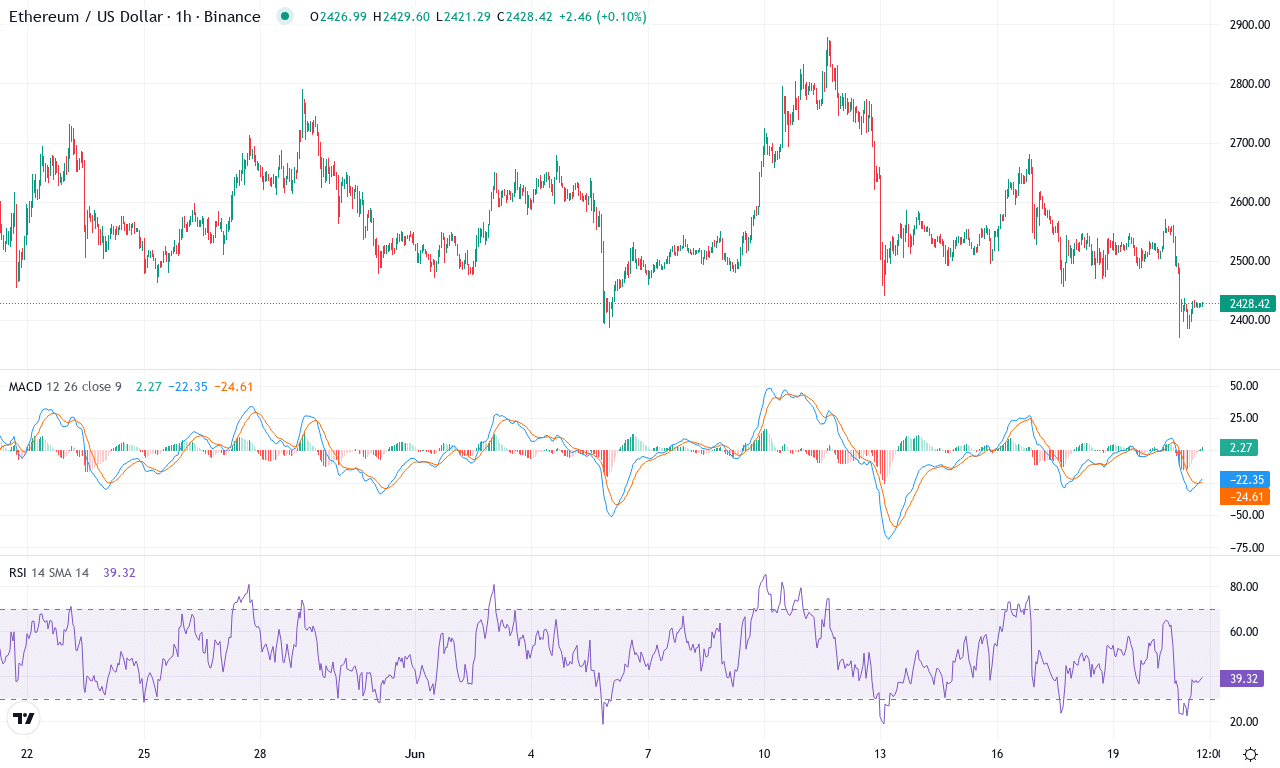
| Crypto | Close | 1W% | 1M% | RSI | ADX | MACD | CCI 20 | ETHEREUM(ETH) | $2429.60 | -5.84% | -4.80% | 43.4 | 15.5 | -2.41 | -130.32 |
|---|
After weeks of sideways action, Ethereum is back in the spotlight—but for all the wrong reasons. This past week delivered a sharp 5.8% slide, capping off a monthly drawdown of nearly 5% and snapping the optimism from that powerful 23% Q1 rally. At $2,429, Ethereum is hovering just above its monthly lows, weighed down by persistent macro headwinds and a wave of profit-taking that is draining bullish momentum. The longer-term trend has soured: Ethereum’s six-month and yearly performances both show steep double-digit declines, reminding us that downside risks remain front and center. While the energy of February’s move is a distant memory, price action suggests we’re entering a high-stakes zone—if buyers don’t regroup soon, the technical outlook suggests an extended fall could be on the cards.
Beneath the surface, trend indicators like ADX have ticked up—a classic sign of rising volatility—but directional movement is now slanted heavily in the bears’ favor. The weekly MACD has shifted deep into negative territory, and shorter timeframes show persistent divergence: both MACD and oscillators signal accelerated bearish momentum, confirming the recent sell-off isn’t just noise. Ethereum is trading below all key moving averages, with the 10- and 20-day EMAs sloping downward and failing to offer much support. The next floor sits near $2,375, aligning with the 100-day average; lose that, and the door opens for a plunge toward $2,000—a psychological round number where I imagine bulls will make their stand. On the upside, a decisive bounce above $2,800 would invalidate the bearish thesis and spark a scramble for higher ground. I’m worried here; remember, you’re not in the red until you sell—just don’t get caught hoping if support gives way.
BNB (BNB) Price Analysis
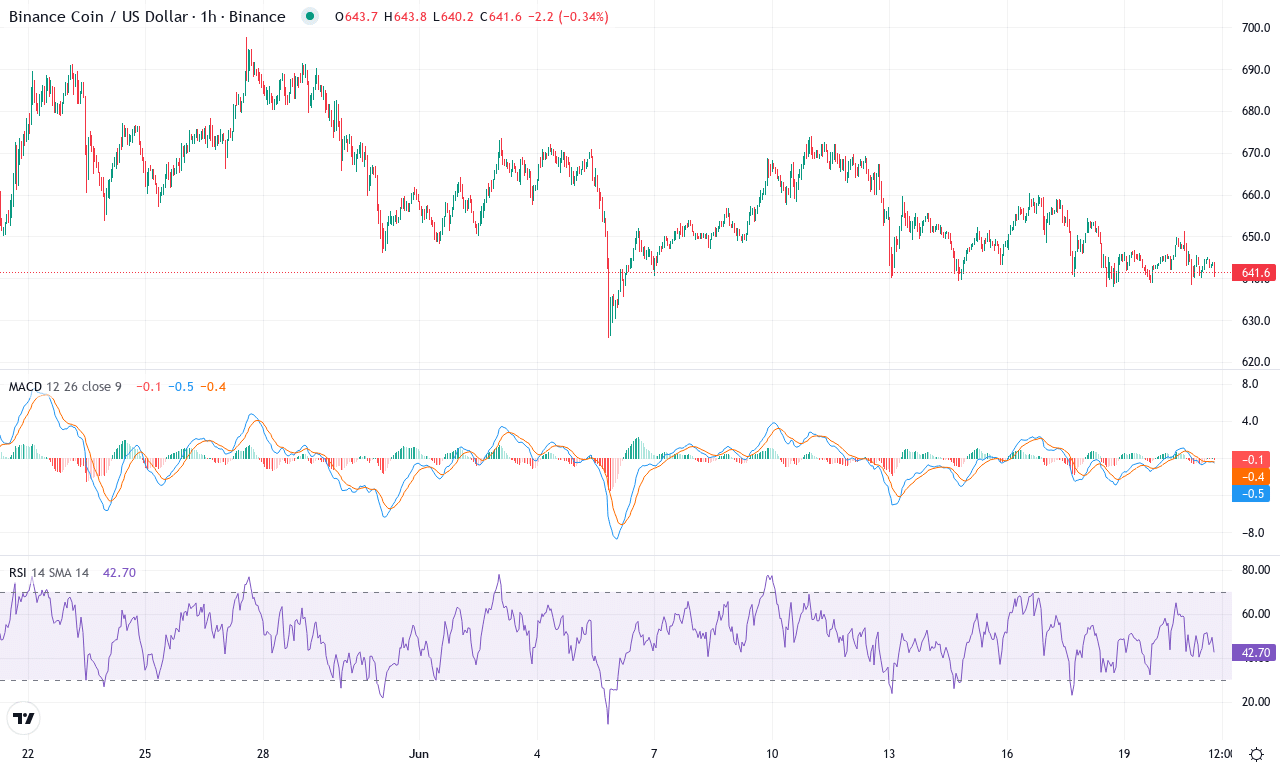
| Crypto | Close | 1W% | 1M% | RSI | ADX | MACD | CCI 20 | BNB(BNB) | $642.00 | -2.04% | -4.66% | 43.6 | 15.5 | -2.76 | -90.36 |
|---|
After a turbulent month marked by sharp reversals, BNB finds itself on precarious footing. Despite a brief attempt to reclaim higher ground above $650, bears have reasserted control, dragging the price back toward $642 and snapping the coin’s 3-month uptrend. The recent -4.7% monthly slide comes alongside a 2% weekly dip, underscoring growing trader anxiety as enthusiasm wanes. It’s hard not to feel a twinge of caution here—when a token struggles at familiar resistance and sinks below key averages, the message is clear: momentum is fading and volatility may only be starting. Macro performance still shows BNB in the green for the past year, but the latest price action begs the question—are bulls simply regrouping, or are risks of an extended fall set to escalate?
Technically, signals suggest a transition from bullish optimism to defensive posture. Trend indicators, such as the ADX crossing into the mid-teens, reveal strong but tilting momentum—positive directional strength lags, and sellers are mounting a challenge. The weekly MACD is losing altitude with a widening negative divergence, while oscillators like the RSI and Ultimate Oscillator teeter near neutral, neither oversold nor primed for a reversal. Price action remains trapped beneath the tightly-knit 10-, 20-, and 30-day exponential moving averages, all clustered near $650, casting a heavy shadow as resistance. Meanwhile, initial support sits precariously at the monthly low near $625; if that gives way, a measured drop toward the psychological $600 zone could unfold with pace. Conversely, a break back above the $660 zone—and especially $673—would invalidate the bearish thesis, potentially reigniting a push to the $700 barrier. Right now, with momentum ebbing and sentiment fragile, this isn’t the time to get complacent—risk is high and nimble execution is essential.
Bracing for the Next Move
Bitcoin holds near pivotal resistance levels, suggesting a potential breakout if buying interest persists, while Ethereum’s proximity to monthly lows warns of possible further declines. BNB’s tight consolidation below key moving averages hints at an impending decision point. Traders should watch for confirmations of trend direction in the coming days, as the balance could quickly shift with any breakout or breakdown.