Bitcoin, Ethereum, And BNB Poised At Critical Resistance As Bulls Test Their Limits
Bitcoin, Ethereum, and BNB have captured market attention after recent formidable gains, standing at critical resistance points that could redefine their trajectories. Bitcoin’s relentless pursuit of $112,000, despite a fresh monthly high, presents a decisive challenge for bulls. Ethereum, meanwhile, is recovering from past corrections, drawing closer to a pivotal $2,900 resistance, while BNB steadies itself near $668, eyeing the $700 mark. Will the current bullish momentum pierce through these barriers, or are the cryptocurrencies on the cusp of a reversal? Let’s break down the technical setup across the board.
Bitcoin (BTC) Price Analysis
| Crypto | Close | 1W% | 1M% | RSI | ADX | MACD | CCI 20 |
|---|---|---|---|---|---|---|---|
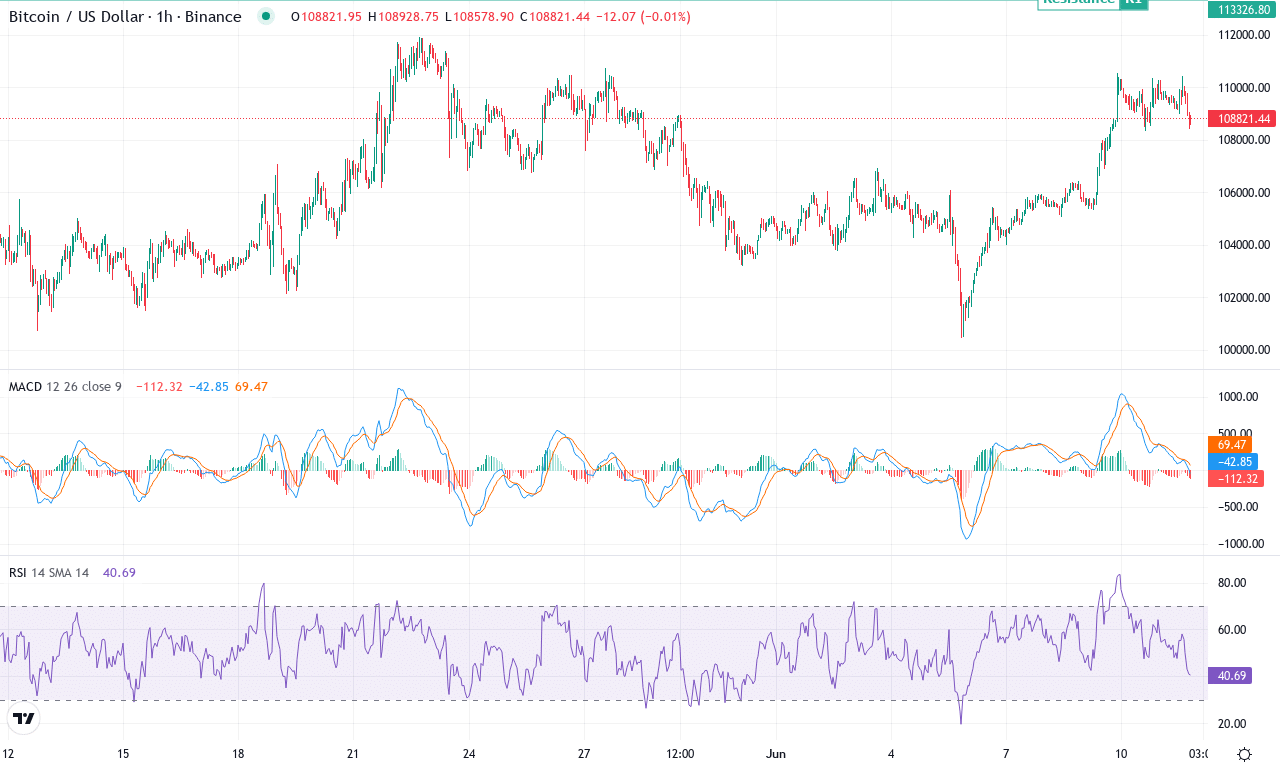
| BITCOIN(BTC) | $108863.14 | 3.24% | 4.85% | 59.2 | 18.9 | 1434.68 | 88.43 |
After an explosive three-month rally that sent Bitcoin soaring over 30%, the world’s largest cryptocurrency is sustaining its upward momentum, now hovering near $109,000 after notching a fresh monthly high above $111,900. This relentless drive, coupled with nearly 5% monthly gains, has traders energized—the weekly performance remains solid despite some intraday swings. Big picture: bullish undertones dominate, and with the yearly gain north of 56%, institutional demand and retail FOMO are clearly fueling this run. Price action is consolidating just beneath a key resistance at $112,000, while psychological round numbers like $110K are being fiercely defended by bulls. If Bitcoin finally clears this barrier on strong volume, I’d be thrilled—momentum could quickly accelerate toward the $120K zone.
On the technical front, trend indicators reflect resounding bullish strength. The average directional index is elevated, confirming a robust trend, and positive directional movement continues to overpower the bears—trend-followers are finding plenty to like here. The weekly MACD is still accelerating above its signal line, suggesting no immediate sign of exhaustion, while the histogram supports upward pressure. RSI hovers in the “hot but not yet overheated” territory, so although conditions are lively, they’re not yet screaming overbought—oscillators hint at persistent buying interest. With price steadily trading above all core moving averages—10, 20, 30, and well past the 50, 100, and 200 periods—every dip so far has attracted fresh bids. Support rests around $103,000, where the previous breakout zone and the 50-day average converge. If buyers lose steam and price slips below this shelf, risks of a steeper correction back toward $95,000 emerge. But for now, all signs point to a breakout; I wouldn’t want to be caught short if $112K gives way.
Ethereum (ETH) Price Analysis
| Crypto | Close | 1W% | 1M% | RSI | ADX | MACD | CCI 20 |
|---|---|---|---|---|---|---|---|
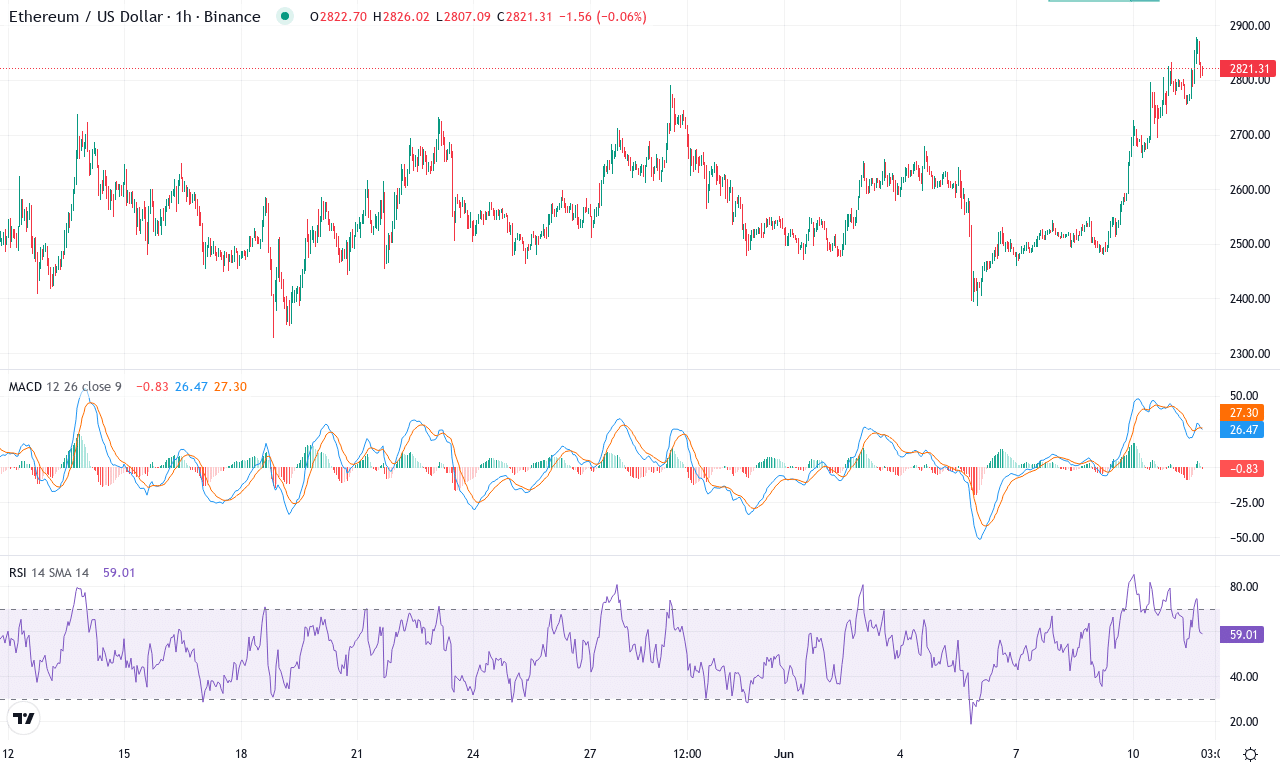
| ETHEREUM(ETH) | $2826.44 | 9.01% | 12.43% | 67.5 | 25.1 | 89.69 | 220.34 |
After a sharp surge this month, Ethereum is finally beginning to shake off its earlier correction, exploding over 12% in the last 30 days and notching a solid 9% weekly gain. The price action has shifted from a risk-off slump—down nearly 27% over the last six months—to a forceful bounce that’s broken above key moving averages and is now testing the upper end of the monthly range. At $2,826, Ethereum sits close to its recent monthly highs, breathing down the neck of a strong resistance zone. It’s hard not to get a little excited when ETH’s short-term recovery syncs with renewed momentum across the altcoin complex. That said, we’re still staring down 2024’s negative yearly performance—a sobering reminder to stay nimble.
Diving into the technicals, the trend structure is strengthening: trend indicators point much higher, and the ADX signals a robust move in motion as bulls regain control. The weekly MACD shows acceleration, while a swelling set of oscillators hint at mounting momentum. Ethereum has reclaimed its 10-, 20-, and 30-period EMAs with conviction—a classic signal that sellers are losing their grip—but a heavy resistance band looms just above, near $2,900. Should buyers break through this level, the next major target emerges at $3,100, in line with pivot and psychological round-number logic. If the rally falters, look for a potential retest of support at $2,600, which aligns with recent pullback lows and the 50-EMA. With the RSI still climbing but not overbought, and no glaring divergence flashing yet, all signs point to breakout momentum—though, as always, a steep correction isn’t off the table if profit-taking surges or market risk-off cues appear. If ETH can clear resistance, I’d be thrilled to ride the next leg up; just remember, the best trades sometimes come from waiting for the market to confirm your thesis.
BNB (BNB) Price Analysis
| Crypto | Close | 1W% | 1M% | RSI | ADX | MACD | CCI 20 |
|---|---|---|---|---|---|---|---|
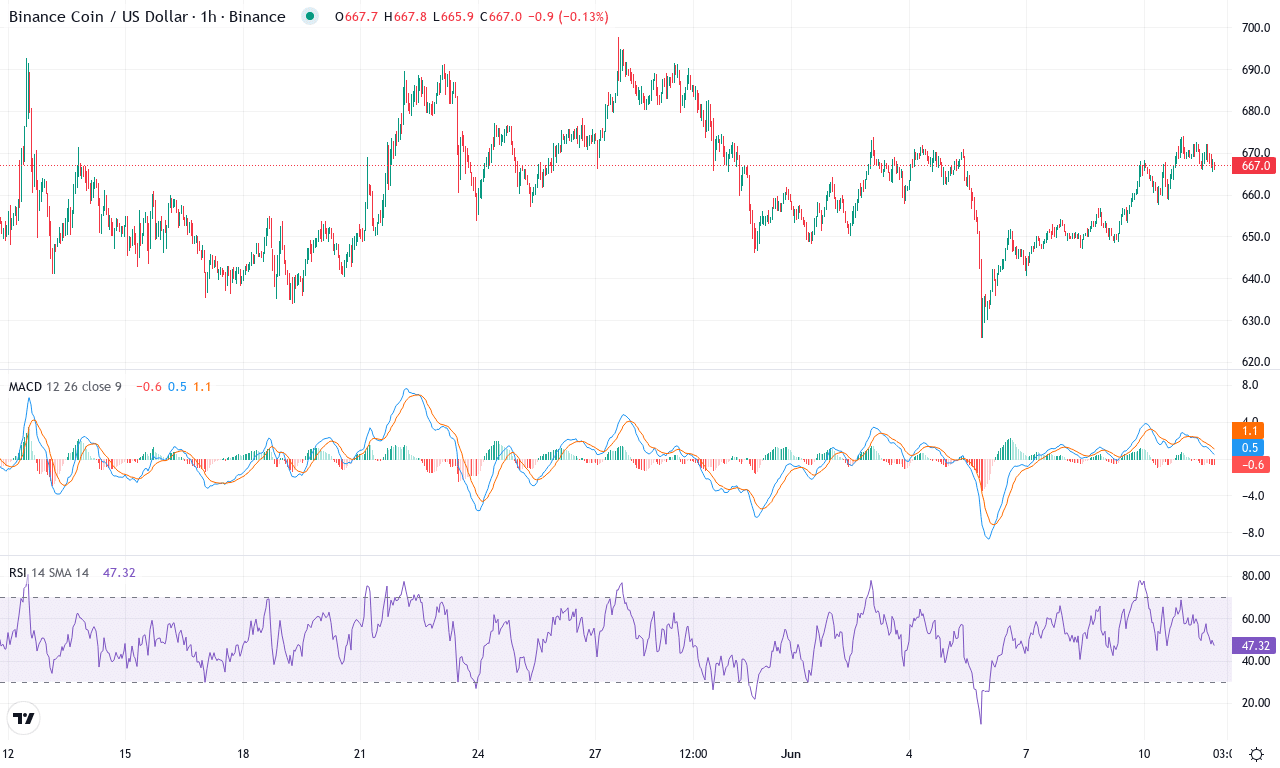
| BNB(BNB) | $667.90 | 0.91% | 2.64% | 55.0 | 20.1 | 4.09 | 40.66 |
After a turbulent quarter that saw BNB surge nearly 17% in three months, the past weeks have cooled to a more measured advance. With the token sitting close to $668 after reclaiming ground from a recent monthly low near $626, BNB is holding above all key moving averages—an undeniably bullish sign. The macro trend has been robust, but I’m alert to the fact that recent 6-month underperformance hints at some profit-taking and hesitation among larger players. Oscillators are hovering at expansionary levels and the technical outlook suggests BNB’s uptrend remains intact, though overbought warnings are flashing if you know where to look. Frankly, watching BNB brush up against major resistance in the $700 zone stirs genuine excitement—this is a psychological battleground worth tracking closely.
Digging deeper, BNB’s trend indicators show bulls still in command: the weekly MACD line is powering above its signal, and the positive directional index remains elevated relative to sellers. Momentum, though, appears to be losing a little steam—the RSI has crept up toward the upper 50s while oscillators like the Commodity Channel Index signal the climb may be overextended. Price action analysis confirms the token is perched above short- and long-term EMAs, fending off any near-term breakdown, but if buyers can’t punch through the $700 barrier, risks of a steep correction back toward support at $646 grow. If bulls do manage a clean breakout above $700, the charts present a clear runway to $760 and then $873 before the next ceiling. If, however, sellers step in and the $646 level gives way, brace for a momentum drain all the way back to the $600 area. Personally, my pulse quickens whenever BNB prowls around historical highs—those are the moments traders remember.
Testing Critical Levels Ahead
Bitcoin remains just shy of $112,000, a level that could dictate its next major move if breached. Ethereum’s rally near $2,900 poses a similar test, while BNB’s attempt to climb past $700 will reveal the strength of buyer interest. A successful break above these resistances could set the stage for further gains, yet hesitation here may signal consolidation or a reversal. Traders are watching closely to see if the bulls have the strength to sustain this advance.