Bitcoin, Ethereum, BCH, MKR Hold Key Levels As Momentum Cools—Will Bulls Or Bears Trigger The Next Major Move
In the wake of recent market moves, Bitcoin and Ethereum find themselves poised at critical junctures, where bullish resolve meets mounting resistance. Bitcoin’s slight weekly retreat puts the spotlight on its ability to maintain momentum above the $105,000 safety net, while Ethereum’s balance teeters as it struggles to regain traction from a 27% rally. With both assets at pivotal levels, the crypto market stands on the brink of either further gains or a sharp pullback that could see volatility return with a vengeance. As traders sharpen their focus on these psychological thresholds, the million-dollar question remains: Which way will the market turn next?
Bitcoin (BTC) Price Analysis
| Crypto | Close | 1W% | 1M% | RSI | ADX | MACD | CCI 20 | BITCOIN(BTC) | $104990.90 | -3.41% | -0.53% | 48.5 | 15.5 | 281.61 | -45.06 |
|---|
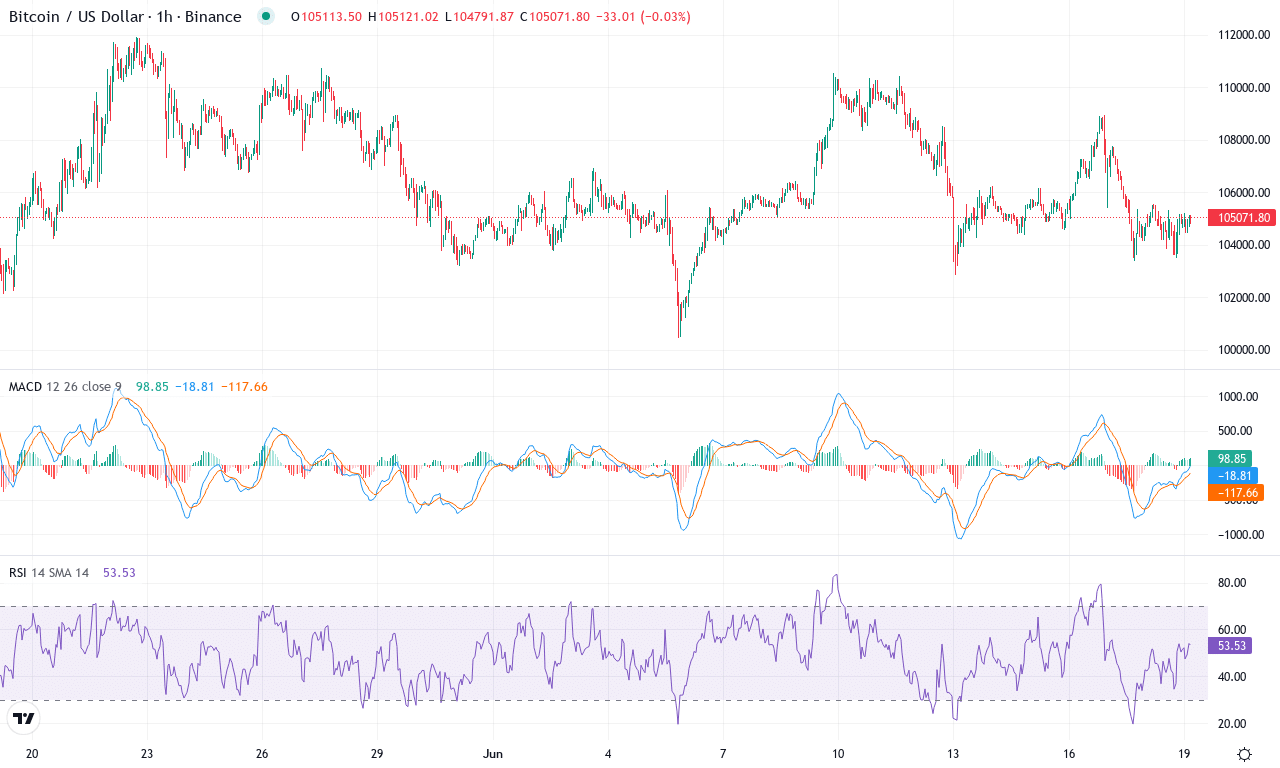
After a month of sideways consolidation, Bitcoin finds itself at a crossroads, having cooled slightly from its recent highs. Despite a modest monthly dip of just over half a percent and a sharper 3% pullback this week, the broader uptrend remains largely intact—a testament to how fierce the bulls were over the past quarter. With price action anchored near $105,000, Bitcoin is hovering above critical psychological support but still well within striking distance of last month’s $112,000 peak. While the longer-term performance numbers are staggering—up nearly 61% year-over-year—the recent loss of bullish momentum is putting traders on high alert for either a breakout resurgence or a steeper correction.
The technical outlook suggests a market at the edge of its seat. Trend indicators still point higher, but the ADX is flattening and the negative directional index is on the rise, showing stalls in trend strength. The weekly MACD remains in positive territory, although its distance from the signal line is narrowing—classic early-warning signs for a potential trend reversal if selling pressure persists. Oscillators like the RSI and Ultimate Oscillator suggest neither overbought nor oversold extremes just yet, but the momentum indicators are starting to slip, adding a degree of suspense as Bitcoin flirts with its 20- and 30-day moving averages. If bulls can recapture resistance at $112,000, Bitcoin could quickly target the major $120,000 zone, with open interest and institutional demand likely fueling the fire. On the flip side, if sellers get the upper hand and break below $100,000, risks include a sharper fall toward $94,800—last month’s key support—raising the threat of long liquidations. Personally, I’m watching this zone with bated breath; a decisive move either way will likely set the tone for the next quarter.
Ethereum (ETH) Price Analysis
| Crypto | Close | 1W% | 1M% | RSI | ADX | MACD | CCI 20 | ETHEREUM(ETH) | $2521.70 | -9.00% | -0.24% | 48.8 | 16.4 | 20.47 | -46.16 |
|---|
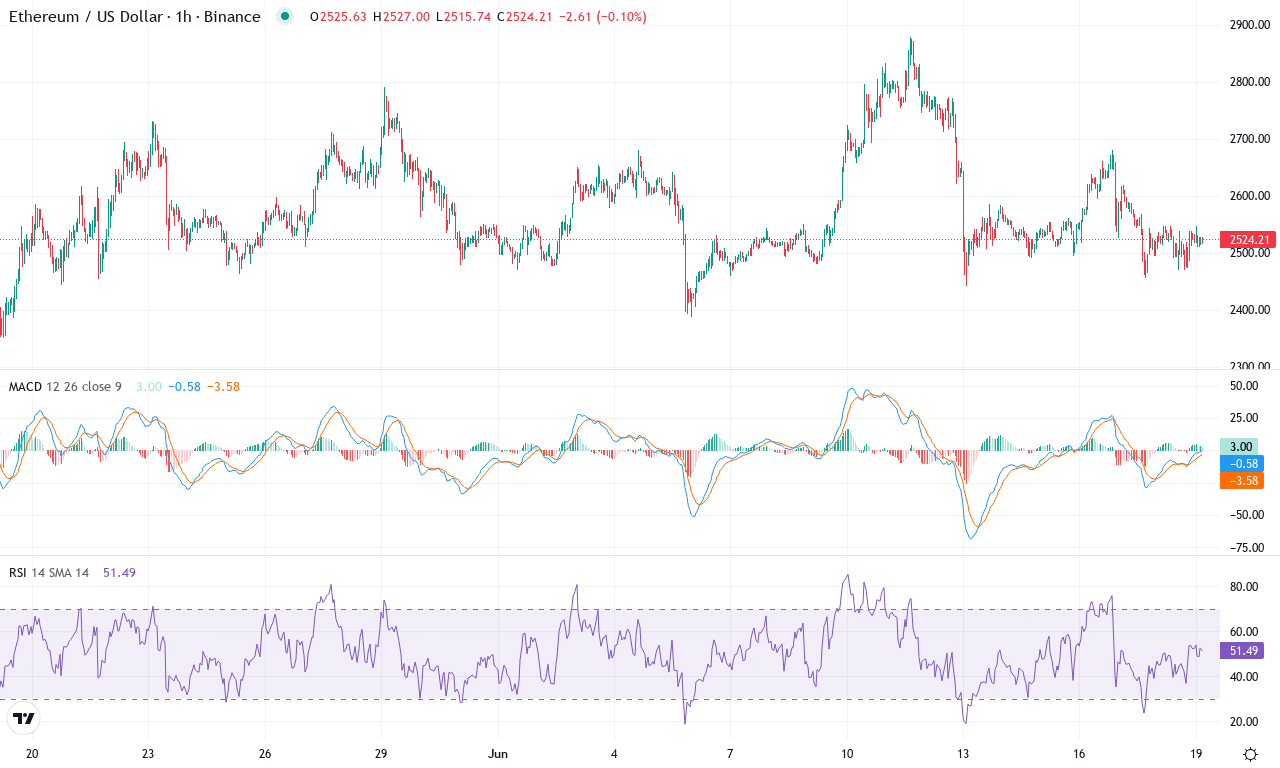
After several weeks of impressive gains, Ethereum appears to have hit a wall, posting a modest monthly dip of just under a quarter percent despite a 27% rally over the prior three months. Volatility has reasserted itself—last week saw ETH drop 9% as selling pressure built steadily from its recent high near $2,880 down to the $2,520 zone. The broader six-month trend is bruised by an extended correction, with the pullback from late-2023 highs weighing on market sentiment. The technical outlook now balances on a knife’s edge: bullish momentum has faltered, but aggressive bears have yet to completely seize control. As we hover above a major psychological level around $2,500, traders are clearly debating whether this is base-building or the start of a steeper descent. Personally, I’m uneasy when strong performers like ETH lose traction this abruptly—volatility cuts both ways, and patience is a virtue here.
Diving into the technicals, trend indicators have softened. The ADX signals a slowing trend, and directional indicators suggest the push between bulls and bears is growing more even. Oscillators flash mixed messages: Ethereum’s RSI is treading water just below the midpoint, hinting at waning momentum, while the MACD has flipped negative across weekly and daily windows—classic signs of bearish reversal risk. Right now, price sits below short- and medium-term exponential moving averages, underscoring that bullish momentum has cooled. Support is clustered around $2,400–$2,350; a break here risks an extended fall toward the $1,900 region. However, if buyers reclaim territory above $2,800, it could reignite breakout momentum targeting the $3,400 resistance zone last seen in early 2024. Ultimately, price action analysis suggests traders should brace for heightened volatility—if $2,500 fails, selling could snowball, but I’d be astonished (and a little relieved) to see buyers mount a fierce comeback from here. Stay nimble.
Bitcoin Cash (BCH) Price Analysis
| Crypto | Close | 1W% | 1M% | RSI | ADX | MACD | CCI 20 | BITCOIN CASH(BCH) | $461.70 | 7.68% | 17.41% | 63.1 | 21.2 | 15.85 | 102.53 |
|---|
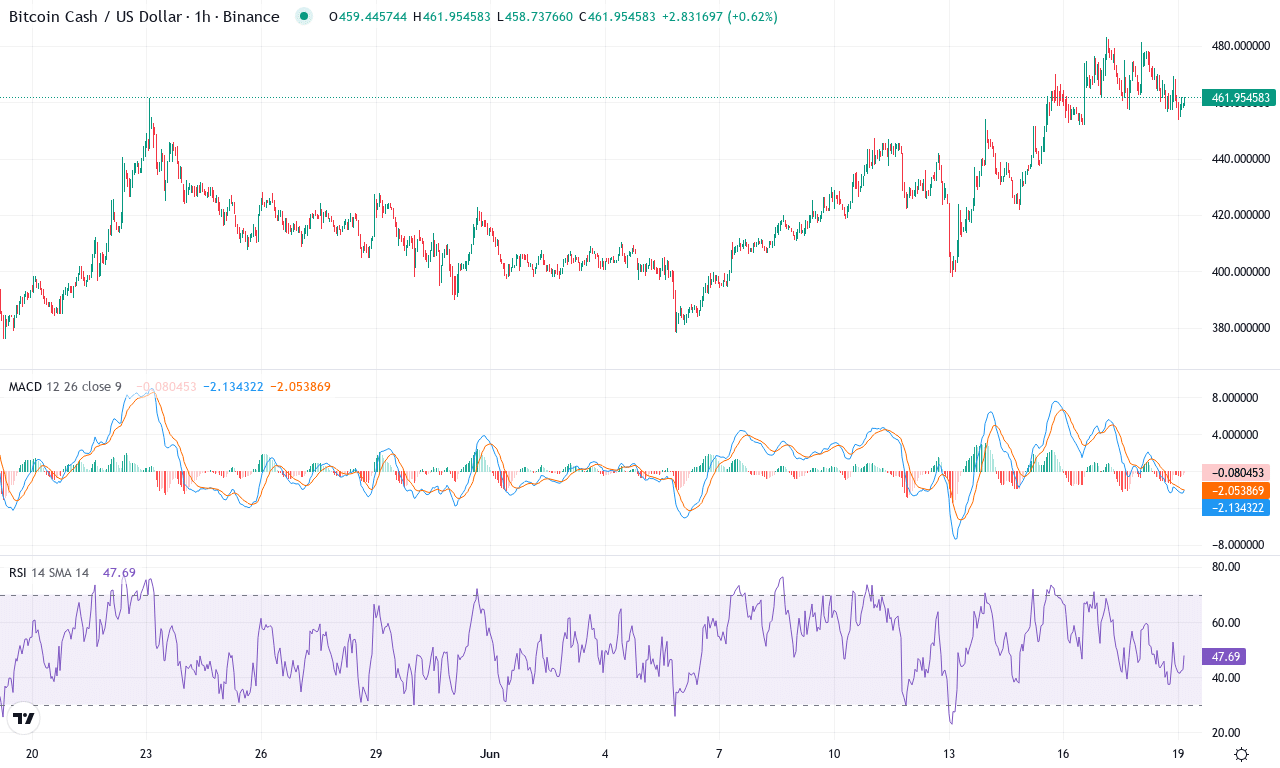
Bitcoin Cash has staged a decisive rebound this month, soaring over 17% and punctuating a volatile three-month run that’s lifted the token more than 38%. After weeks of tight consolidation, BCH is breaking out toward its monthly high near $483, closing the week with an almost 8% gain. The momentum is unmistakable, and the technical outlook shows bullish gears grinding higher: trend indicators are solidly positive, and moving averages fan upward, confirming renewed institutional and retail demand. For traders watching the support-resistance game, BCH is now pressing against a pivotal barrier near $480—a level that, if breached, could clear the runway for a further rally and attract fresh inflows. I’ll admit, seeing this kind of momentum makes me sit a bit taller—especially after such a protracted sideways stretch.
Drilling into the technicals, the weekly MACD shows acceleration with a widening gap between the MACD and its signal—the kind of separation that typically precedes a rally extension. The strong reading from trend indicators, along with bullish oscillators, reflects growing conviction among buyers. BCH holds well above short- and medium-term moving averages, suggesting the recent upturn isn’t a head fake. Meanwhile, a robust RSI hovers near the overbought zone, signaling enthusiasm but hinting at the risk of a short-term cooldown or profit-taking surge. If bulls manage to clear resistance at $483, the next target aligns with the psychological $500 mark. However, should sellers emerge and drag BCH below immediate support at $450, risks of a steep correction back toward $410 can’t be ignored—watch for volatility spikes. For now, all signs point to breakout momentum, but agility is a must: when the crowd gets exuberant, long liquidations can come fast and furious.
Maker (MKR) Price Analysis
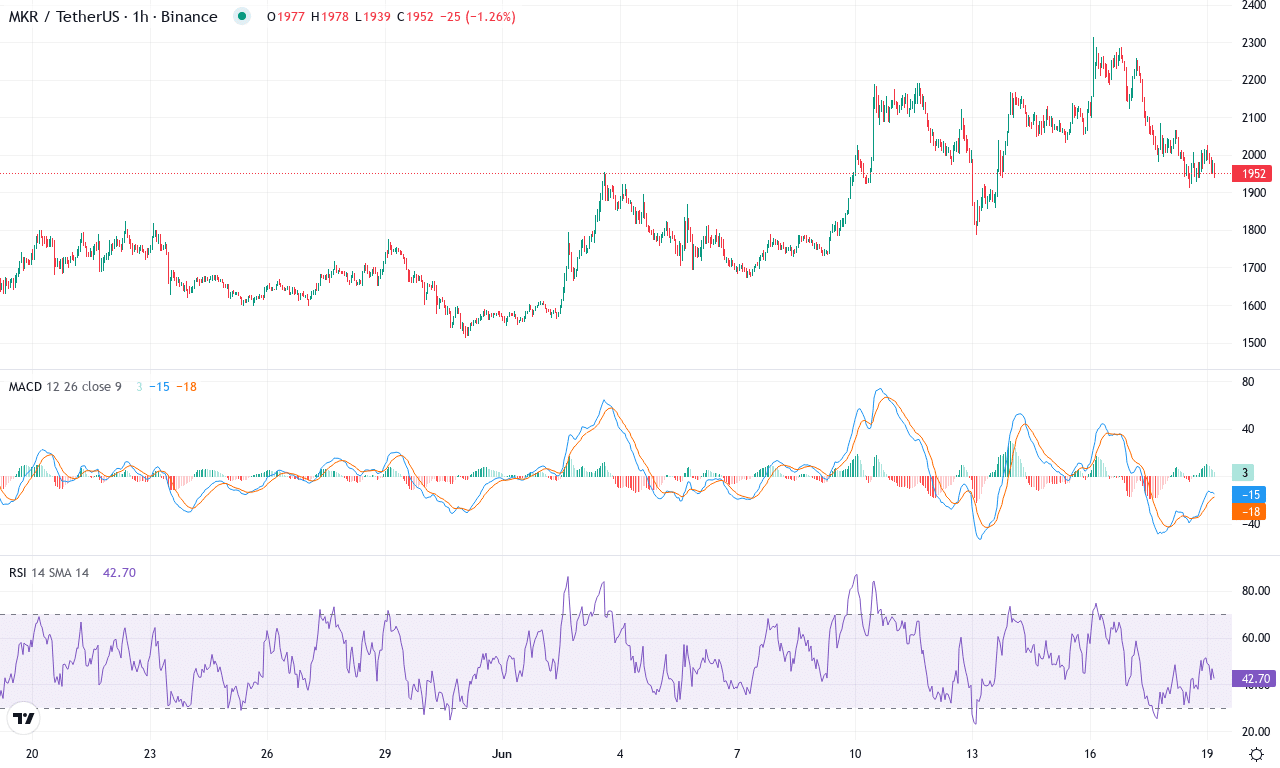
| Crypto | Close | 1W% | 1M% | RSI | ADX | MACD | CCI 20 | MAKER(MKR) | $1950.00 | -5.34% | 12.46% | 52.9 | 22.0 | 94.97 | 27.50 |
|---|
After a robust surge that drove Maker (MKR) up over 12% this month—part of an impressive 54% spike over the last quarter—the price has recently lost some altitude, falling back from its $2,314 monthly high to hover near $1,950. The broader technical outlook remains cautiously optimistic, with MKR holding above all key moving averages and clinging to the upper end of its recent trading range. Still, last week’s modest pullback—shaving off over 5%—suggests a bout of profit-taking and perhaps an early warning that bullish momentum might be cooling. The market’s appetite for risk is in flux, and as a trader, I can feel the tension rising every time price action approaches the psychological $2,000 mark. If MKR sustains strength above this threshold, bulls could quickly regain the upper hand.
Digging into the technicals, trend indicators remain firmly in the bulls’ favor—ADX readings above 20 confirm a strong trend, while positive directional indices outpace the negatives. The weekly MACD signals sustained upward pressure, though current histogram flattening hints that breakout momentum is waning. Oscillators display mixed signals: RSI holds steady in bullish mid-range territory, while overbought warnings from the Stochastic and CCI imply traders should brace for heightened volatility or even a steep correction if sellers intensify profit-booking. MKR’s price is holding well above its 50- and 100-day averages, underscoring underlying demand, but sustained failure to reclaim $2,200 resistance keeps the door open for a retest of the $1,800–$1,785 support zone. If bulls break decisively above $2,200, upside targets extend toward $2,730—yesterday’s monthly pivot high—while a rejection here could quickly send MKR back toward the $1,650 level. The setup is loaded with suspense: whichever side wins control next, expect a sizable move. I’ll be watching closely—this is the kind of action that keeps me glued to the charts.
Key Levels Under Pressure
Bitcoin hovers near $105,000, with its strength in question as buyers eye a rebound. Ethereum’s recent rally faces a test; a slip below $1,800 could usher in fresh challenges. Momentum is crucial for both coins, and traders should watch for decisive moves to determine if bulls or bears will set the tone ahead.