Bitcoin Eyes $112K Breakout As Ethereum and BNB Coil For Volatility Surge
Bitcoin has staged an impressive surge, closing in on the key $112,000 resistance after a volatile ascent from lows around $104,600. With a promising 47% year-on-year rise, the crypto king faces a crucial test as it grapples with psychological levels. Will this momentum catapult it to unprecedented heights, or do exhaustion signals hint at a temporary lull? Let’s take a closer look at the signals behind the move.
Bitcoin (BTC)
| Crypto | Close | 1W% | 1M% | RSI | ADX | MACD | CCI 20 |
|---|---|---|---|---|---|---|---|
| BITCOIN (BTC) | $104945.60 | -0.80% | 8.21% | 51.6 | 21.1 | 839.80 | -101.18 |
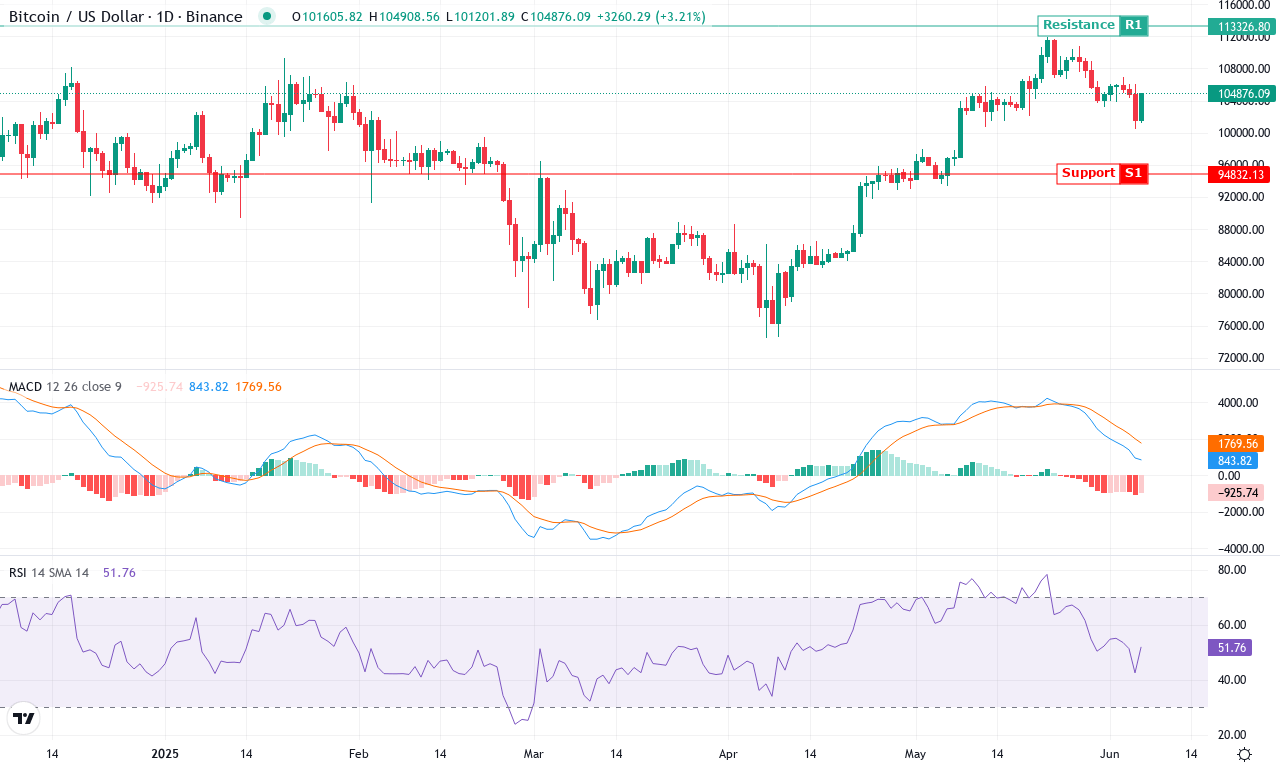
After a standout month with nearly 8% gains and an impressive 20% surge over the past three months, Bitcoin is holding its ground near $104,600 following a volatile climb that peaked just above $111,900. This price action comes after a brief shakeout, with weekly performance slipping slightly negative, but the macro trend remains unmistakably bullish—up a remarkable 47% year-on-year. The emotional undercurrents among traders are unmistakable: after weeks of choppy, sideways trading, this latest breakout has reignited conviction that a new all-time high could be within reach. If Bitcoin manages to stay above the psychological $100,000 zone, there’s a palpable sense of anticipation for a renewed push toward uncharted territory.
Drilling into the technicals, trend indicators remain robust—the average directional index is well into the “strong trend” zone, and the positive DI outpaces the negative, signaling that bulls are still dominant. The weekly MACD shows notable acceleration, reinforcing upward momentum, although short-term oscillators hint at potential exhaustion: RSI is elevated but not yet signaling outright overbought, and the stochastic oscillators are curled over, a subtle warning of potential profit-taking. Price is parked above all major moving averages, showcasing broad institutional support; the 10-day EMA and the volume-weighted moving average are both beneath current price, confirming underlying strength. Key resistance looms overhead near the recent $112,000 high, while first support sits at $103,000, with $98,000 as a crucial psychological backstop—if bears regain control, risks of an extended fall toward $95,000 rise quickly. All signs point to continued breakout momentum, but, as always, watch for volatility surges and long liquidations if sentiment flips. If Bitcoin breaks $112,000 with conviction, I’ll be thrilled—and I won’t be alone.
Ethereum (ETH)
| Crypto | Close | 1W% | 1M% | RSI | ADX | MACD | CCI 20 |
|---|---|---|---|---|---|---|---|
| ETHEREUM (ETH) | $2519.08 | -4.32% | 38.48% | 53.1 | 26.9 | 68.78 | -104.30 |
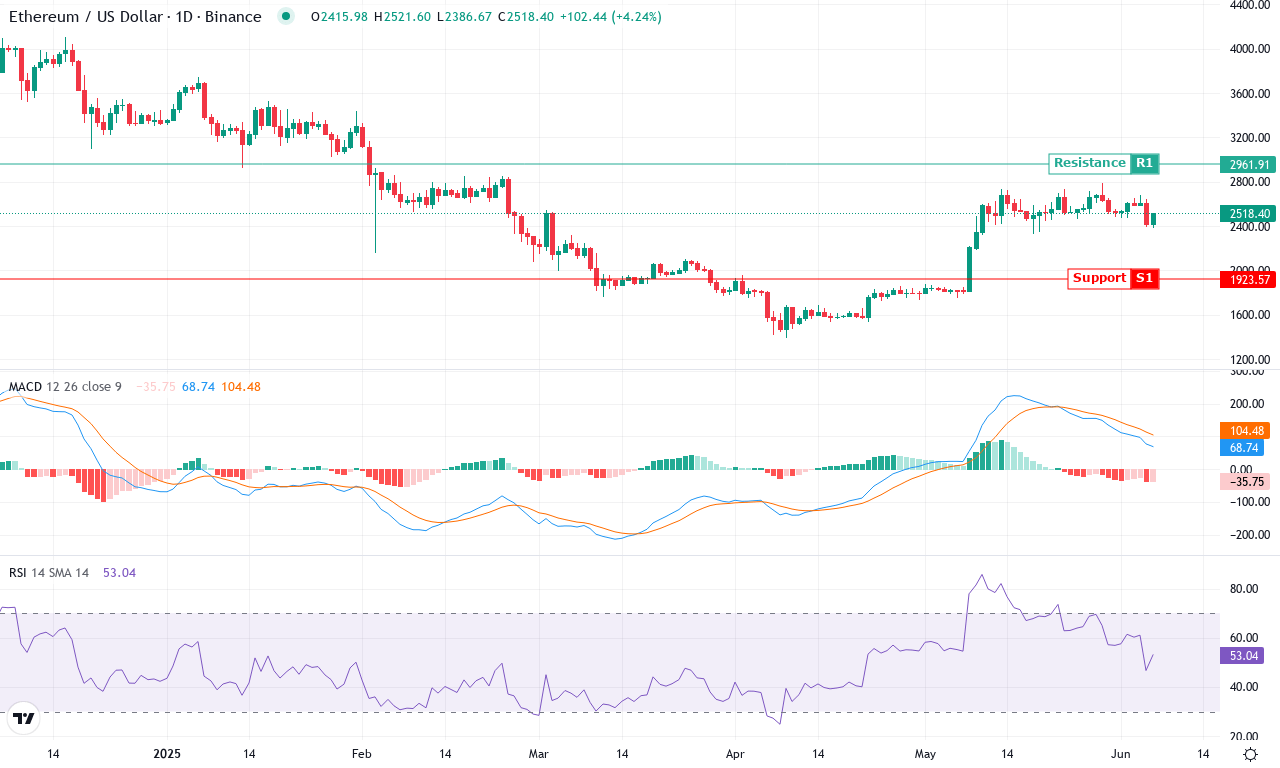
After a red-hot start to June, Ethereum has cooled off, ceding nearly 5% this week as bulls lose momentum near the $2,800 resistance. Still, with a monthly gain close to 38%, the broader technical outlook remains constructive—though the mood is increasingly tense as ETH teeters above key support around $2,500. A steep correction earlier in the spring is still echoing in the background, but ETH’s ability to reclaim and hold above the 10- and 20-day exponential moving averages has kept traders alert for a breakout or a sharp reversal. I can’t help but feel a sense of anticipation: Ethereum is hovering at a crossroads, and the next major move could set the tone for Q3 volatility.
Diving deeper, trend indicators remain firm, with the ADX suggesting trend strength is building, even as the gap between positive and negative directional movement narrows. The weekly MACD shows renewed acceleration after a wild, oversold dip, while oscillators like RSI hover just above the midline—enough room for another push higher before overbought conditions emerge. Price action analysis shows Ethereum sitting atop a cluster of moving averages, lending initial support near $2,500, but with clear headwinds at $2,800. If bullish momentum can clear the $2,800 resistance, then the next technical targets emerge at $2,960 and $3,400. Conversely, failure to hold the $2,500 zone risks an extended fall toward $2,350, where buyers might regroup. Bottom line: trend signals point higher, but I’m watching for a volatility surge—tighten your stops and stay nimble, because the stakes are rising fast.
BNB (BNB)
| Crypto | Close | 1W% | 1M% | RSI | ADX | MACD | CCI 20 |
|---|---|---|---|---|---|---|---|
| BNB (BNB) | $650.50 | -3.66% | 7.86% | 48.6 | 25.9 | 3.78 | -122.14 |
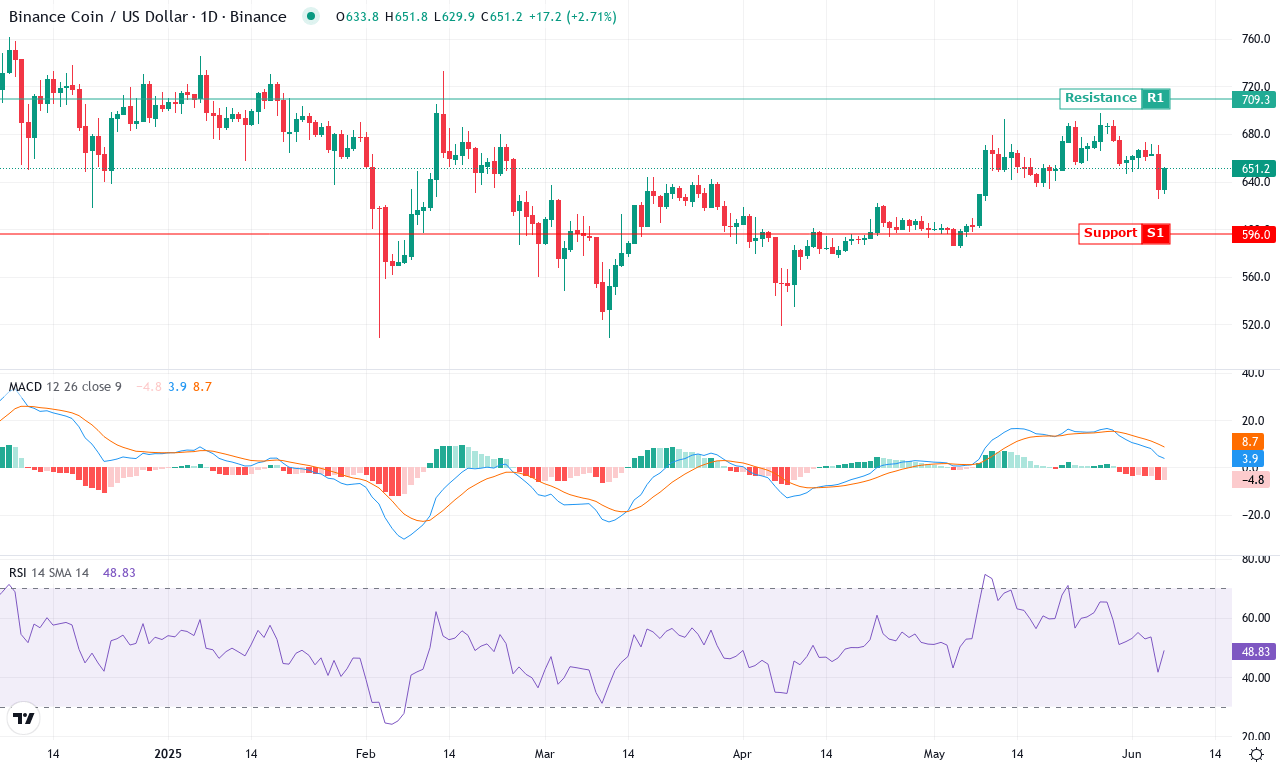
After a powerful start to the month, BNB found itself cooling off just below the $700 barrier—a psychologically loaded resistance level that’s proven tough to crack. This week, price action slipped -3.6%, interrupting its recent bullish march and reminding traders that no uptrend is ever a straight line. Monthly gains still sit handsomely near 8%, yet zooming out to the quarter, we see BNB up only about 9%, a modest reward for those who’ve weathered higher volatility and a brutal -13% drawdown over six months. With the larger market showing rotation and heavy profit-taking, the technical outlook suggests BNB is in a tactical holding pattern—if bulls can regain momentum, fireworks could follow. As always, I’m watching for signs of fresh institutional demand: a strong push above $700 might just be the trigger.
Diving into the technicals, trend indicators are painting an interesting—and somewhat contradictory—picture. The ADX reading is robust, suggesting trend strength, but the gap between positive and negative lines has narrowed, hinting at hesitation among buyers. The weekly MACD has curled lower, signaling the previous bullish momentum is waning, though price is still trading above all key moving averages, including the EMA 50 and 200, which usually means the bigger-picture trend remains intact. Oscillators hover in the upper-mid range, with RSI just below classic overbought territory—momentum is there, but stalling. BNB sits halfway between a strong support floor at $600 and that stubborn $700 ceiling. If bulls clear resistance decisively, the next price target aligns with classic pivot points near $760, while failure could spark a retest of $600 or even spark a steeper correction to the mid-$500s. For now, BNB’s sideways churn feels like the calm before a volatility surge—brace for some drama either way.
Bulls on the Brink
Bitcoin is pushing against the $112,000 resistance, poised for a breakout if momentum sustains, while a failure could see it retreat to nearby support. Ethereum, at a pivotal $2,500, awaits directional clarity, teetering between bullish continuation and reversal. BNB faces its own challenge below $700, with traders eyeing either a consolidation phase or an imminent lift-off. The coming days will offer crucial insights into whether the bulls can maintain control or if a shake-out is due.