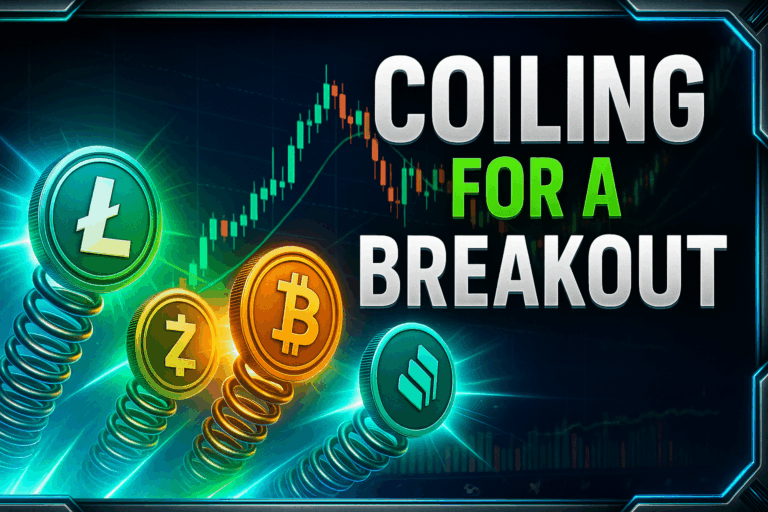
BNB And Solana Coil For Explosive Breakouts As Bulls And Bears Skirmish At Key Resistance
BNB and Solana are tightening like springs, poised for potential breakouts as they grapple with pivotal resistance zones. With BNB consolidating above $660 and Solana hovering near $158, both cryptocurrencies find themselves at critical junctures after mixed signals in recent weeks. Can bulls gather enough momentum to breach these barriers, or will the market see a pullback before the next drive? Let’s take a closer look at the signals behind the move.
BNB (BNB) Price Analysis
| Crypto | Close | 1W% | 1M% | RSI | ADX | MACD | CCI 20 |
|---|---|---|---|---|---|---|---|
| BNB (BNB) | $662.10 | -0.60% | -0.15% | 53.2 | 20.8 | 2.82 | -9.66 |
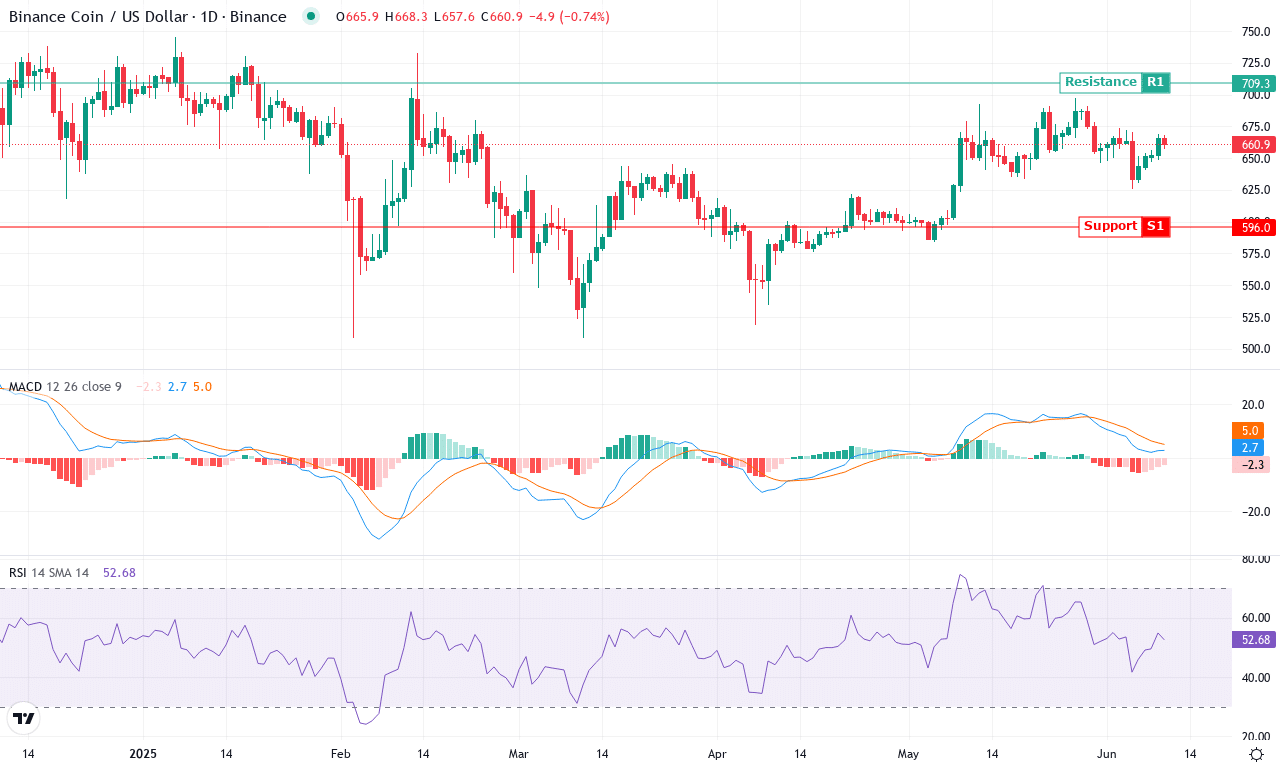
After a dramatic Q1 rally, BNB is settling into a tense consolidation phase, having given up nearly 7% over the last six months but tacking on a strong 20% gain for the quarter. This week, price hovered just above $660—a stone’s throw shy of monthly highs yet facing stiff resistance. The story here is one of cautious optimism: buyers pushed BNB toward $700 in recent weeks but failed to hold those levels, highlighting a market wrestling with both profit-taking and fresh institutional inflows. I’m seeing volatility contract after what looked like a breakout attempt fizzled, but with such a tight price range, tension is mounting for the next substantive move.
Technically, BNB is at a crossroads. The robust trend indication is unmistakable—trend indicators remain elevated, signaling the broader bull phase is intact, while the weekly MACD line continues to accelerate above its signal. However, momentum oscillators are flashing early warnings: although the Relative Strength Index hovers near 53 (mid-range, but climbing), the Awesome Oscillator and momentum readings are mixed, hinting at waning short-term bullish thrust. Price continues to orbit tightly around its 10- and 20-day exponential moving averages, showing the market’s indecision just below the key resistance near $700. The $646 level stands as immediate support, with a break potentially triggering a steeper correction toward the psychological $600 mark. Conversely, if bulls regain control and BNB clears $700, breakout momentum could target the next resistance around $760. I admit—if we see sustained volume push through that ceiling, I’d be tempted to add on the next leg higher. For now, traders should remain alert; BNB is coiled for action, and the next directional move promises fireworks.
Solana (SOL) Price Analysis
| Crypto | Close | 1W% | 1M% | RSI | ADX | MACD | CCI 20 |
|---|---|---|---|---|---|---|---|
| SOLANA (SOL) | $158.29 | 0.94% | -10.90% | 48.9 | 19.9 | -2.62 | -23.24 |
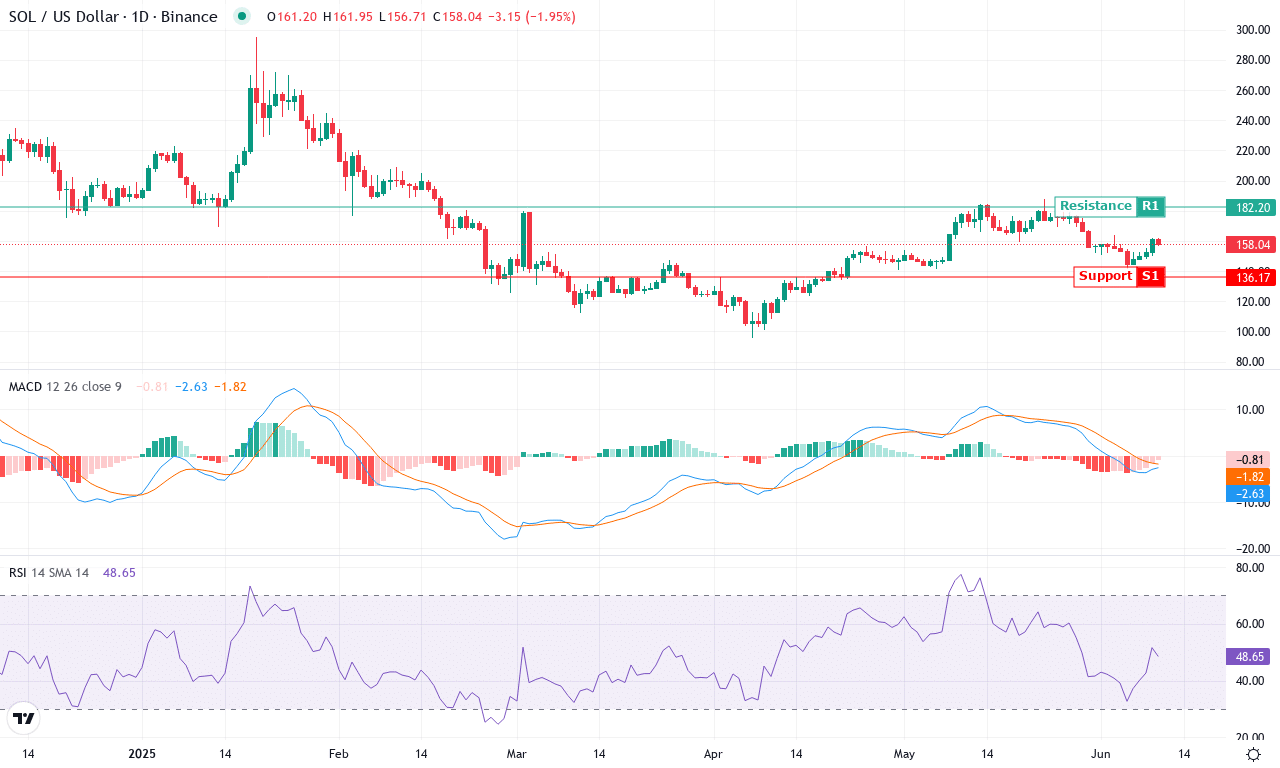
Solana is emerging from a turbulent month, marked by an abrupt 11% drawdown that followed a monster 26% rally across the last quarter. Volatility is still pulsing through the chart—after a rollercoaster swing between $187 and $142, Solana is currently hovering near $158, almost exactly where it opened the week. This equilibrium is tense: after a steep multi-month correction, bulls are fighting to reclaim momentum. The broader macro picture is a tug-of-war: yearly performance has flipped negative, and some battered long positions have been flushed out, but that dose of fear is exactly what can spark a real directional surge. As we approach an inflection point, my sense is that opportunistic buyers are circling, betting that a transformative breakout could be within reach—if Solana can get back on the attack.
Technically, the picture is as dramatic as ever. Trend indicators confirm that momentum is both elevated and uncertain—the average directional index remains robust, but directional movement lines are flatlining, a classic sign of indecisive trend strength. The weekly MACD, while negative, has begun to curl upward, suggesting bearish momentum is stalling and a reversal might be brewing. Oscillators tell two stories: the RSI is comfortably above 48, right in neutral territory, but stochastic readings are climbing, hinting at early accumulation. Price action analysis shows Solana is pinned near its short- and long-term moving averages, crunched between multiple pivots. If bulls can clear resistance at $182, I’ll be watching for an explosive breakout that targets the spring high at $188 and maybe even $208. But if sellers manage to drag price below support at $137, risks extend sharply lower. That suspense is what keeps me coming back—right now, Solana is perched at a technical crossroads, and all signs point to a high-stakes battle just ahead.
Breakout or Breakdown?
BNB is consolidating above $660, setting the stage for a possible bullish breakout, while Solana teeters near $158, eyeing resistance. If buying pressure persists, both may advance — though any falter could prompt a retracement. Traders now await decisive moves that will signal either a continuation or a correction.