BNB Battles $700 Ceiling While Solana Bulls Defend Key Lows—Will Momentum Snap?
BNB’s mid-year rally is reaching a pivotal moment as it flirts with the critical $700 resistance, while Solana bulls hold their breath near key support levels. With BNB recently trimming its gains, the challenge lies in whether this dip signals a mere pause or foreshadows a deeper correction. Meanwhile, after a volatile few months, Solana is testing the resilience of its recent lows, setting up for a potential reversal or continued slide. Can these assets muster the strength to reclaim momentum and defy the looming resistance? Let’s break down the technical setup across the board.
BNB (BNB) Price Analysis
| Crypto | Close | 1W% | 1M% | RSI | ADX | MACD | CCI 20 |
|---|---|---|---|---|---|---|---|
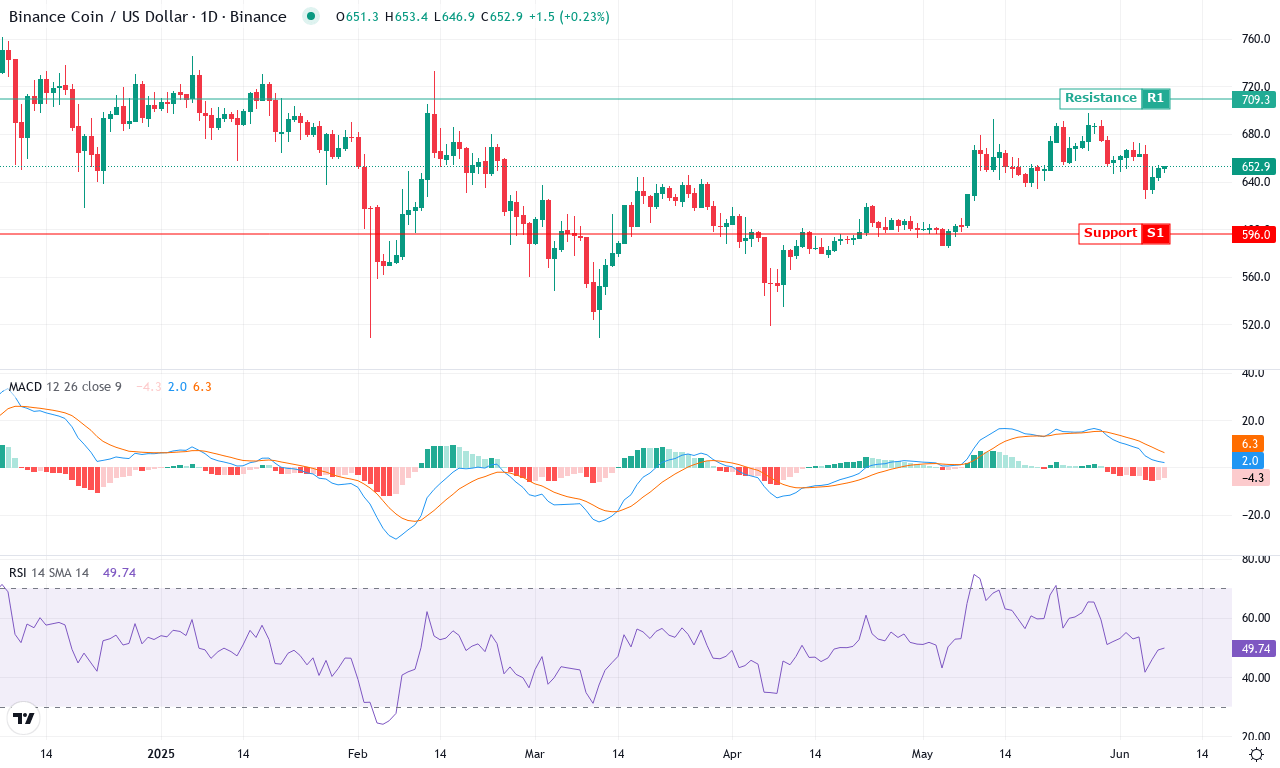
| BNB (BNB) | $652.10 | -0.97% | 3.71% | 49.4 | 24.1 | 1.98 | -84.37 |
After an early-June surge to nearly $700, BNB has slipped from its highs, closing the week marginally lower and casting a shadow of indecision over its recent rally. The monthly uptrend is still intact, with BNB logging over 3% gains in June and an impressive 17% advance across three months, but the past week’s -1% dip hints at emerging resistance and profit-taking—no surprise as we hover close to the psychological $700 mark. Larger time-frame trend indicators remain firmly positive, yet price is now sandwiched between ascending support near $625 and a stubborn ceiling at $700. It’s palpable: buyers who chased the breakout are finding the air thin up here. As a trader, I’m on alert—when an extended rally hits heavy supply, volatility can return fast.
Technically, the picture is nuanced but leans cautious in the short term. Trend strength is robust, with directional oscillators supporting the bulls, and the weekly MACD still showing acceleration, albeit at a slower clip. However, momentum indicators—especially the RSI, which is flirting with the overbought zone—suggest a pause may be imminent. BNB holds above all key moving averages, with the 10-day EMA at $654 offering immediate nearby support. Should sellers gain traction and push prices below $645, a steeper correction toward $635–$625 is possible, aligning with the monthly low and a confluence of moving average support. Conversely, a clean breakout above $700 could trigger a fresh momentum wave, targeting resistance around $760 and, in a best-case scenario, the euphoric highs posted earlier this year. Until BNB chooses a side, I’m keeping position size nimble—because in these tight ranges, whipsaw risk is real.
Solana (SOL) Price Analysis
| Crypto | Close | 1W% | 1M% | RSI | ADX | MACD | CCI 20 |
|---|---|---|---|---|---|---|---|
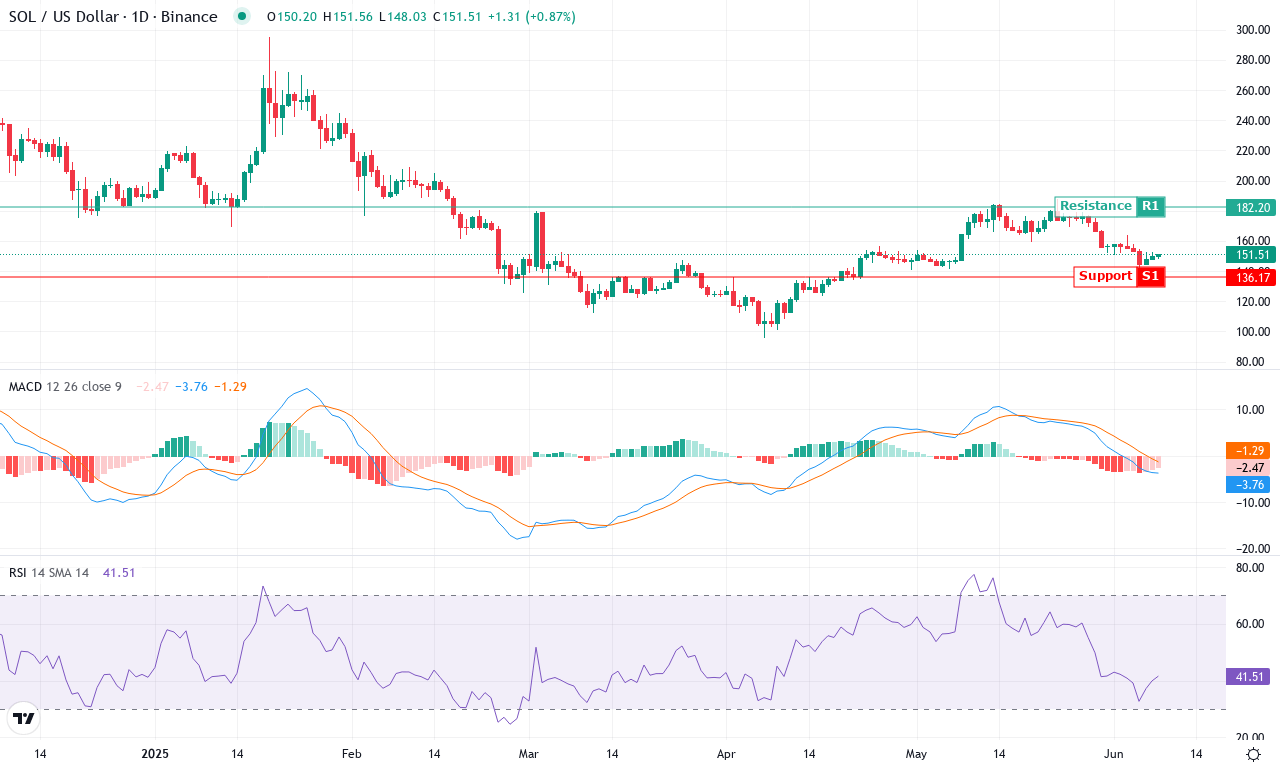
| SOLANA (SOL) | $150.70 | -3.75% | -8.28% | 40.6 | 23.3 | -3.83 | -89.10 |
After a blistering first quarter, Solana has hit turbulence, sliding 8% this month and giving up much of April’s momentum. The bears seized control after SOL tagged a monthly high near $188, driving price down toward $150 despite an impressive 18% gain over the last three months. This steep reversal follows a run of profit-taking and outflows, with Solana now hovering just above its six-month lows—the kind of backdrop that tests bulls’ conviction. Yet, even as volatility surges, the broader technical picture remains mixed rather than outright bearish. There’s suspense building as the market crowds around the $150 handle—if you crave volatility, this is prime time to pay attention.
Digging into the technicals, trend indicators suggest weakening bullish momentum. Despite a still-elevated Average Directional Index, the positive trend signals have been overtaken by rising bearish pressure—trend strength is high, but the direction is slipping. The MACD shows convergence, and with the histogram ticking lower, momentum looks set to stall. Oscillators—including RSI and others—have tumbled from recent highs, flashing signs of exhaustion but stopping short of screaming “oversold.” Price action analysis confirms that SOL is hugging key moving averages; the $154–$158 region is now short-term resistance, while psychological support looms at $140. If bulls can reclaim $160, a move back to $182 and possibly higher could unfold. Otherwise, risks of an extended fall open up below $140—if that cracks, $115 becomes the next major battleground. At this crossroads, patience and discipline are crucial—I’m on edge watching whether sellers have another leg, or if the Solana crowd snaps back in force.
Will Resistance Yield or Persist?
BNB remains on the cusp of breaking the formidable $700 threshold, yet its recent pullback raises questions about sustained momentum. For a bullish continuation, BNB must reclaim and hold above this level decisively. Meanwhile, Solana clings to support in hopes of sparking a rebound. Traders should await confirmation through volume and price reactions to gauge whether these assets will overcome their current stalemates or succumb to further pressure.