
BNB, OKB, and KAIA Coil Near Pivotal Levels as Volatility Surge Beckons
In an ever-volatile crypto market, BNB, OKB, and KAIA have each arrived at crucial junctures, facing considerable resistance amidst market-wide oscillations. While BNB has retraced slightly following a monthly high, OKB faces its own pressure around the psychological $52 mark, and KAIA shows signs of revival with an eye-catching 41% weekly rally. With each asset poised on significant technical levels, the ensuing moves could either reignite bullish momentum or signal a deeper correction. Let’s break down the technical setup across the board.
BNB (BNB) Price Analysis
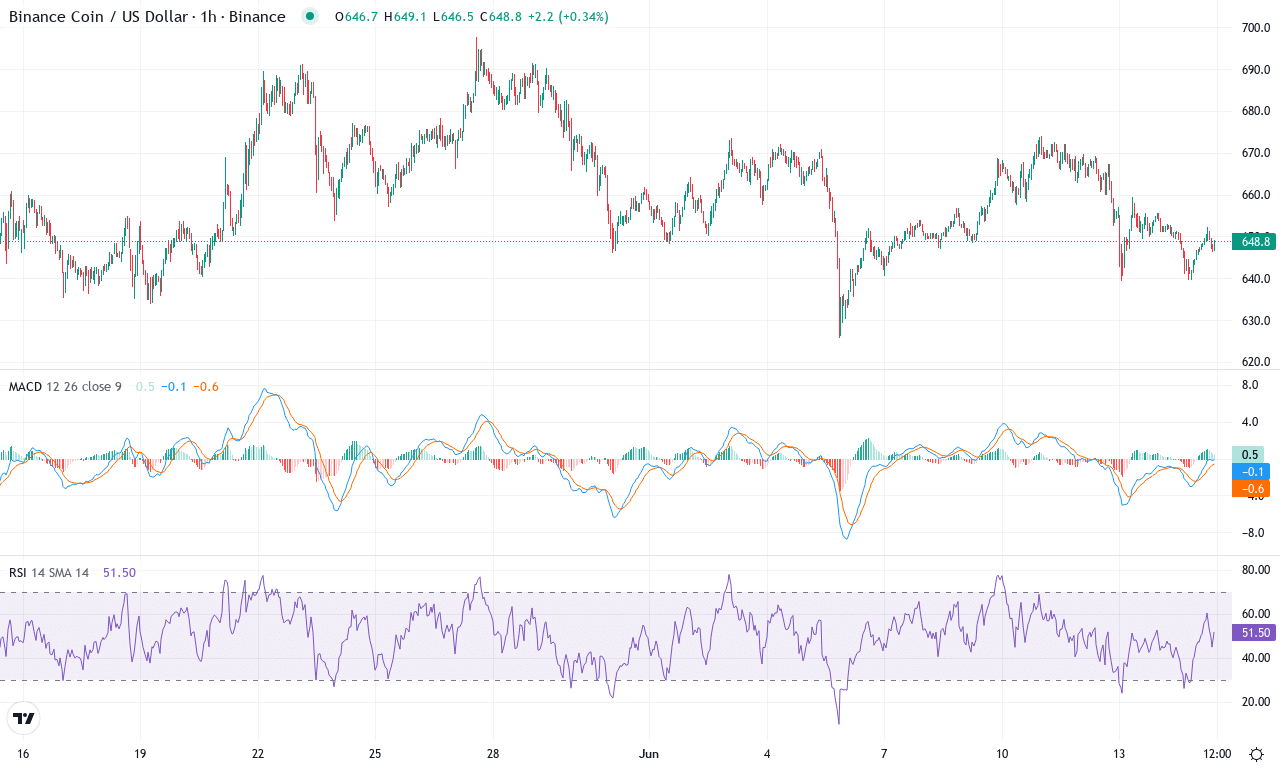
| Crypto | Close | 1W% | 1M% | RSI | ADX | MACD | CCI 20 | BNB(BNB) | $649.00 | -0.35% | -0.43% | 47.0 | 18.2 | 0.69 | -77.63 |
|---|
After a turbulent month marked by wide price swings, BNB finds itself caught in a tug-of-war between bulls and bears. Despite brushing up against a monthly high near $698 before retreating to lows just above $625, BNB has given back almost half a percent over the past four weeks, and short-term price action looks subdued after last week’s marginal slip. However, zooming out to the three-month view, it’s clear that the longer-term uptrend is intact—with gains of nearly 8%—suggesting that underlying bullish momentum hasn’t fully dissipated. Still, after a 6-month rally that lost steam and shifted negative, traders are right to question whether this is just a pause or the beginning of a deeper correction. Frankly, I’m on edge here—BNB is hovering over some critical support levels, and volatility could explode in either direction.
Technically, BNB’s trend indicators remain firm, with directional signals still favoring bulls, but strength has clearly waned as the ADX softens and positive momentum fades. The weekly MACD, once charging upward, has started to flatten—often an early sign of caution that fresh buying power is drying up. Oscillators, too, are cooling, with the RSI backing off from overbought territory, and short-term momentum readings flipping negative. Price currently trades around $649, tightly sandwiched between clustered exponential moving averages, and threatened by overhead resistance at $710. A significant battle is shaping up: If bulls can reclaim the $710 resistance zone, a retest of the $760 region (and beyond) is in play. But if sellers force a close below the $646 pivot and confidence cracks, BNB risks an extended fall toward $596—where I’d expect panic to escalate. All eyes are on the next move—stay nimble, because whichever side wins, this range is bound to break soon.
OKB (OKB) Price Analysis
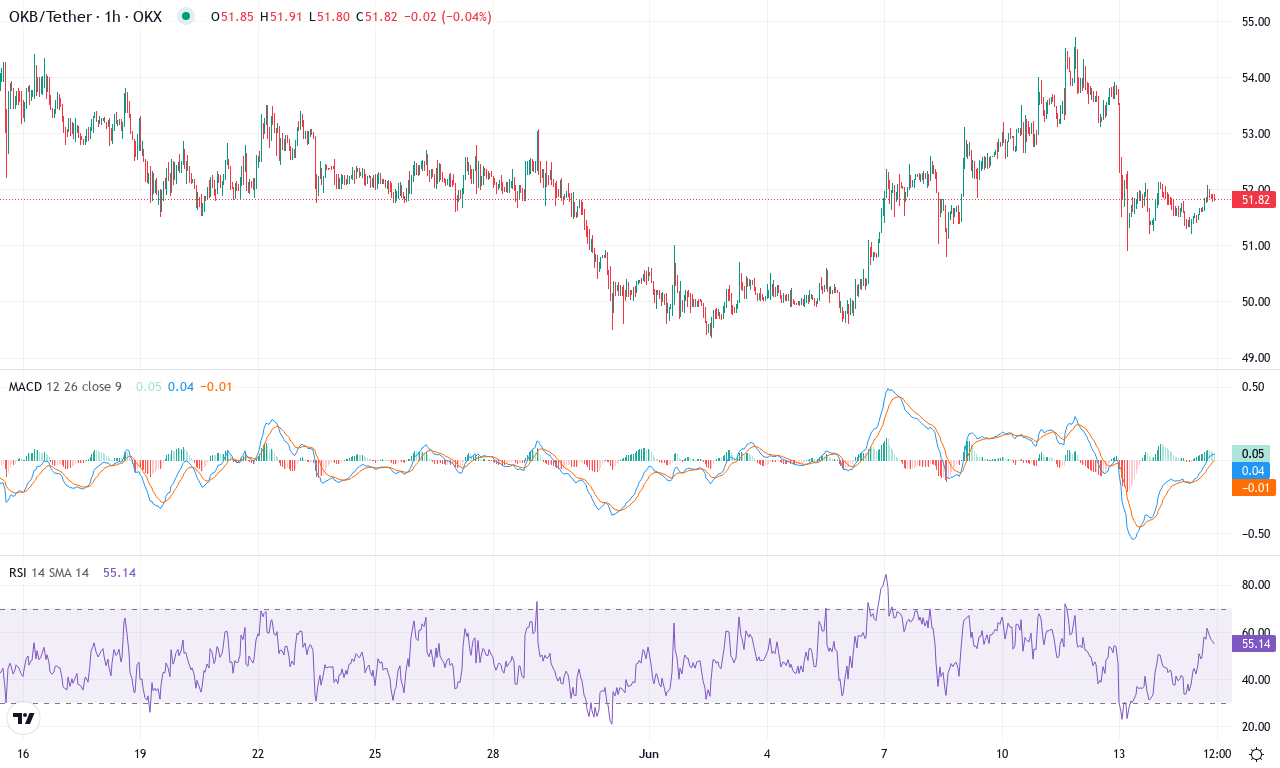
| Crypto | Close | 1W% | 1M% | RSI | ADX | MACD | CCI 20 | OKB(OKB) | $51.83 | -0.67% | -3.07% | 48.7 | 12.8 | 0.09 | 12.24 |
|---|
After a strong start to the quarter, OKB has surrendered much of its momentum, slipping over 3% in the past month and struggling to hold the psychological $52 level. The token’s price action paints a picture of uncertainty: weekly performance is flat, and the recent push towards the month’s high near $54.72 has withered as sellers stepped in. Macro sentiment reflects a choppy market—longer-term gains remain intact with solid 3- and 12-month advances, but recent reversals underline mounting profit-taking and a defensive posture among bulls. Given how OKB faded from its upper monthly band, this market feels like it’s pausing for breath—and as any trader knows, periods of hesitation can resolve with sudden force.
Technically, OKB finds itself at a crossroads. Trend indicators are softening; while overall strength still registers in mid-teens levels, the fact that negative directional movement is rising above the positive hints at weakening bullish momentum. The weekly MACD barely holds above its signal line, and momentum oscillators are rolling over—signaling that sellers are quietly regaining control. Notably, the daily RSI just slipped under the 50 mark, confirming a lack of near-term conviction. Price action is now tangled around the major moving averages, with the token parked right at its 10- and 20-day EMAs—classic sign of indecision. Immediate support emerges at $50; a decisive close below this could trigger a sharp pullback toward $48 or even $45, where the next major support bands lie. On the upside, reclaiming $54 with conviction would open the door to a retest of the $58–$60 region. For now, the technical outlook suggests a cooling phase—and personally, I’m watching for a volatility surge. Whichever camp seizes the initiative here is poised to dominate the coming weeks.
Kaia (KAIA) Price Analysis
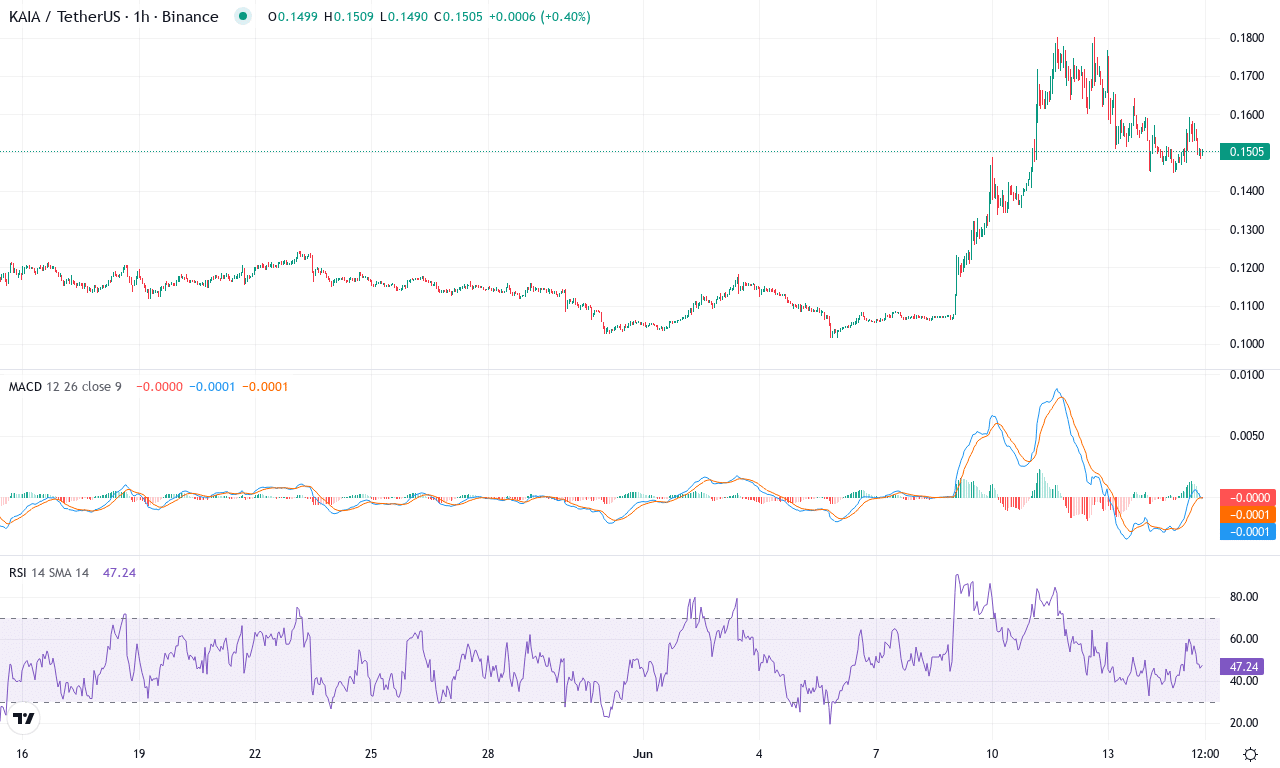
| Crypto | Close | 1W% | 1M% | RSI | ADX | MACD | CCI 20 | KAIA(KAIA) | $0.15 | 40.79% | 27.22% | 61.5 | 29.3 | 0.01 | 91.43 |
|---|
After a rocky start to the quarter, Kaia (KAIA) is now catching traders’ attention with an impressive one-week surge of nearly 41%, reclaiming much of what was lost in its recent steep correction. On the monthly chart, the crypto has rebounded sharply from the $0.10 area—its lowest level in thirty days—to trade just below $0.16, marking a visibility shift in sentiment. While its six-month trajectory still shows deep scars, with a drawdown of over 43%, the immediate reversal suggests that buyers are stepping back in, perhaps eyeing a broader recovery. Oscillators are responding, too: the Commodity Channel Index just exploded out of deep oversold territory and the Ultimate Oscillator bounced above 60, a clear sign that upward momentum is gaining steam. I have to admit, seeing this kind of snapback after a brutal selloff stirs a bit of FOMO—even for a disciplined trader.
The technical backdrop for KAIA suggests volatility is far from over. Trend indicators—including a strong ADX reading and a rapidly rising positive directional component—confirm that bullish momentum is swelling, while the MACD line has just flipped above its signal on multiple timeframes. Price is now perched right at the cluster of short- and medium-term exponential moving averages, with the 10, 20, and 30-day EMAs closely bunched near the current level—a zone that acts as both support and a launchpad for possible breakout momentum. Immediate resistance sits near $0.18, the recent monthly high; if bulls can clear this barrier, a push toward $0.22 becomes conceivable, especially if momentum oscillators remain exuberant. Conversely, failure to hold above the local breakout zone could bring bears back for a retest of $0.13, where several moving averages converge. For now, the technical outlook suggests the tide has turned for KAIA, but traders should brace for rapid swings as volatility surges and profit-taking hits the order books. Stay sharp—this one has all the markings of a battleground.
Awaiting the Next Move
BNB is nearing a critical support as it cools from recent highs, OKB struggles to stay above $52, and KAIA aims to hold its impressive rally gains. Each requires new momentum to break their current stalemate, setting the stage for potential continuation or correction. Prudence in monitoring these levels will be crucial; the developing trends will reveal the market’s next decisive direction.