BSV Teeters Above Breakdown As ZEC and Injective Coil Near Pivotal Levels—Will Bears Tighten Their Grip Or Will Bulls Snap Back
Bitcoin SV (BSV), Zcash (ZEC), and Injective are navigating precarious waters as the crypto market flirts with pivotal levels. While BSV teeters on the brink after a 12% monthly drop, ZEC stalls beneath a critical $50 threshold, and Injective hints at a consolidation before a potential breakout. As traders hold their breath, opportunities and risks loom large. Will the bears tighten their grip or will bulls mount a comeback? Let’s break down the technical setup across the board.
Bitcoin SV (BSV) Price Analysis
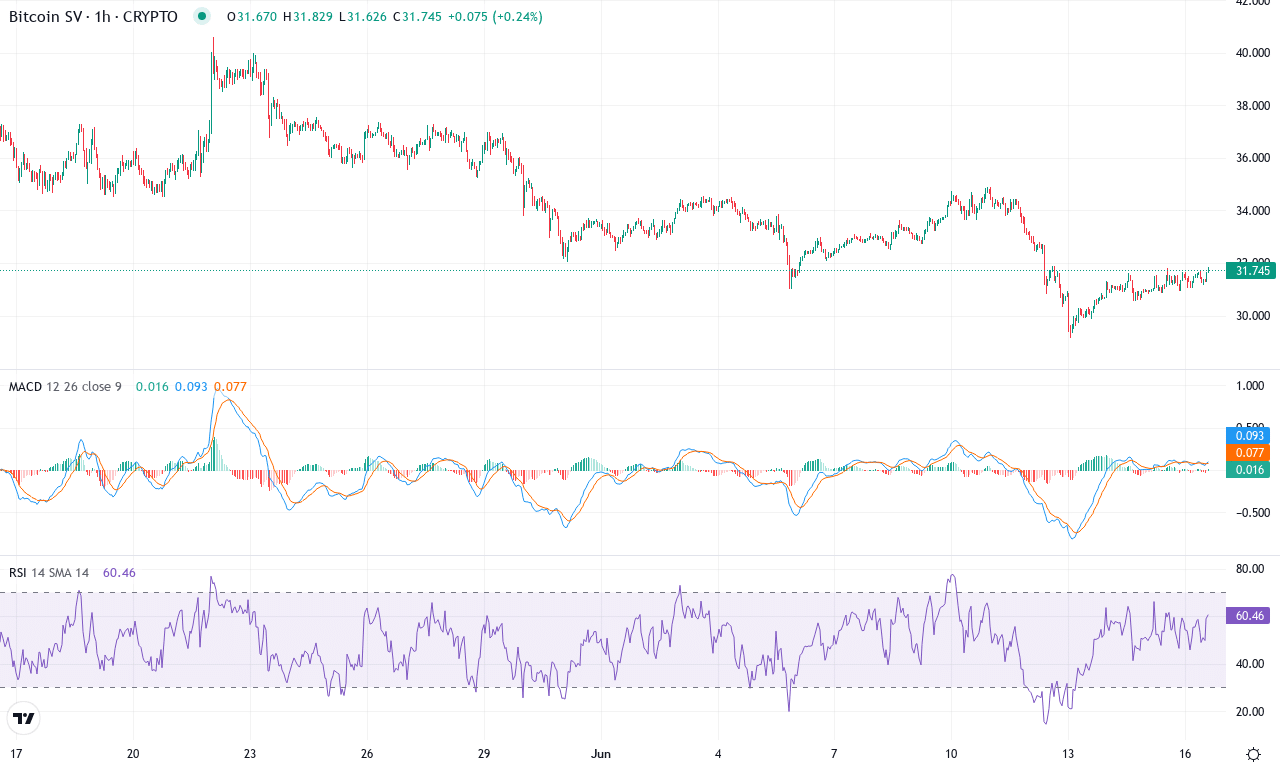
| Crypto | Close | 1W% | 1M% | RSI | ADX | MACD | CCI 20 | BITCOIN SV(BSV) | $31.82 | -3.94% | -12.04% | 42.0 | 21.7 | -1.18 | -88.43 |
|---|
After a wave of intense volatility over the past quarter, Bitcoin SV (BSV) is trading under heavy pressure, recently sliding to $31.82 and closing out the month deep in the red. The token’s monthly decline surpasses 12%, compounding a six-month collapse of nearly 50%. BSV has surrendered nearly all its early-year gains, succumbing to consistent selling and long liquidations. No surprise, traders are uneasy—myself included—as the price clings just above the major monthly low at $29.13, an area that’s fast becoming critical support. If this zone breaks, risks of an extended fall become very real, given the mounting bearish momentum and lack of immediate positive catalysts. The technical outlook right now is pessimistic, and BSV bulls are conspicuously absent.
Technically, the situation is grim. Trend indicators point lower: the average directional index remains elevated, revealing a strong—albeit negative—trend, while negative directional movement dominates. The weekly MACD confirms accelerating downside momentum, sinking further into bearish territory. Oscillators like the RSI hover in oversold zones, but there’s little sign of mean reversion—no bounce yet from these depressed levels. Price action is glaringly beneath all the key moving averages (EMA10 through EMA200), a classic bearish signal. The loss of the $34–$36 band (which previously acted as crucial support and now flips to resistance) only compounds the risk. If sellers crack the $29 floor, BSV could quickly unravel toward the next psychological milestone at $24. If, against the tide, bulls reclaim $36, it might ignite a short-term recovery, but that scenario looks increasingly distant. For now, downside risk is front and center—if you’re long, buckle up and set those stops tight.
Zcash (ZEC) Price Analysis
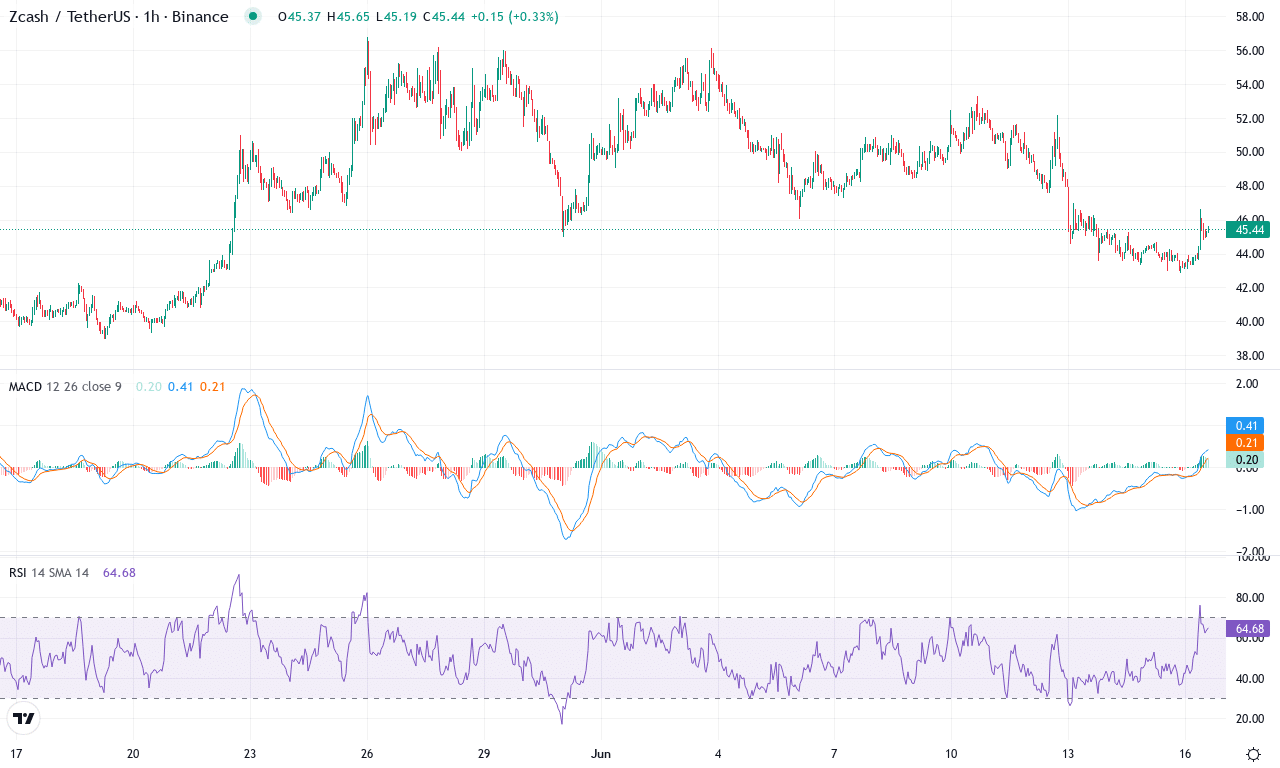
| Crypto | Close | 1W% | 1M% | RSI | ADX | MACD | CCI 20 | ZCASH(ZEC) | $45.64 | -6.32% | 13.05% | 46.1 | 21.6 | -0.14 | -125.16 |
|---|
After a powerful three-month climb capped by a robust 13% monthly rally, Zcash (ZEC) seems to be stalling below $46 as short-term momentum fades. The coin hit a monthly high near $57, but its weekly performance has slipped into the red, hinting at emerging profit-taking and hesitation among late bulls. Despite a backdrop of 100%+ yearly gains, this recent stall comes as price action compresses between converging moving averages and stalls beneath the key psychological barrier at $50. I’ll admit, watching ZEC peel back just after a promising surge stings—it’s a classic case of nerves at a resistance shelf, where every trader wonders if reversal risk is real, or just a shakeout before the next leg higher.
Technically, the overall picture demands caution. Trend indicators like the ADX remain elevated, supporting the notion of a still-robust underlying trend, but directional signals are beginning to tilt negative as ZEC underperforms its short-term moving averages. The MACD has lost much of its upward acceleration, crossing its signal line from above and showing early signs of bearish momentum, while oscillators reveal a classic loss of upside drive. The RSI, slipping toward neutral ground but not yet oversold, echoes this cooling enthusiasm. If bulls can reclaim and hold above $50, the doors could open toward the previous high near $57—possibly rewarding those patient enough to keep stakes in play. But a convincing rejection here risks an extended fall back toward support in the $43–$41 band. My focus now is on confirmation: a strong bounce above $50 would tip the scales back to breakout momentum, but until then, I’m watching for signs of further long liquidations and a possible deeper correction. Stay on your toes—this volatility can punish hesitation as quickly as overconfidence.
Injective (INJ) Price Analysis
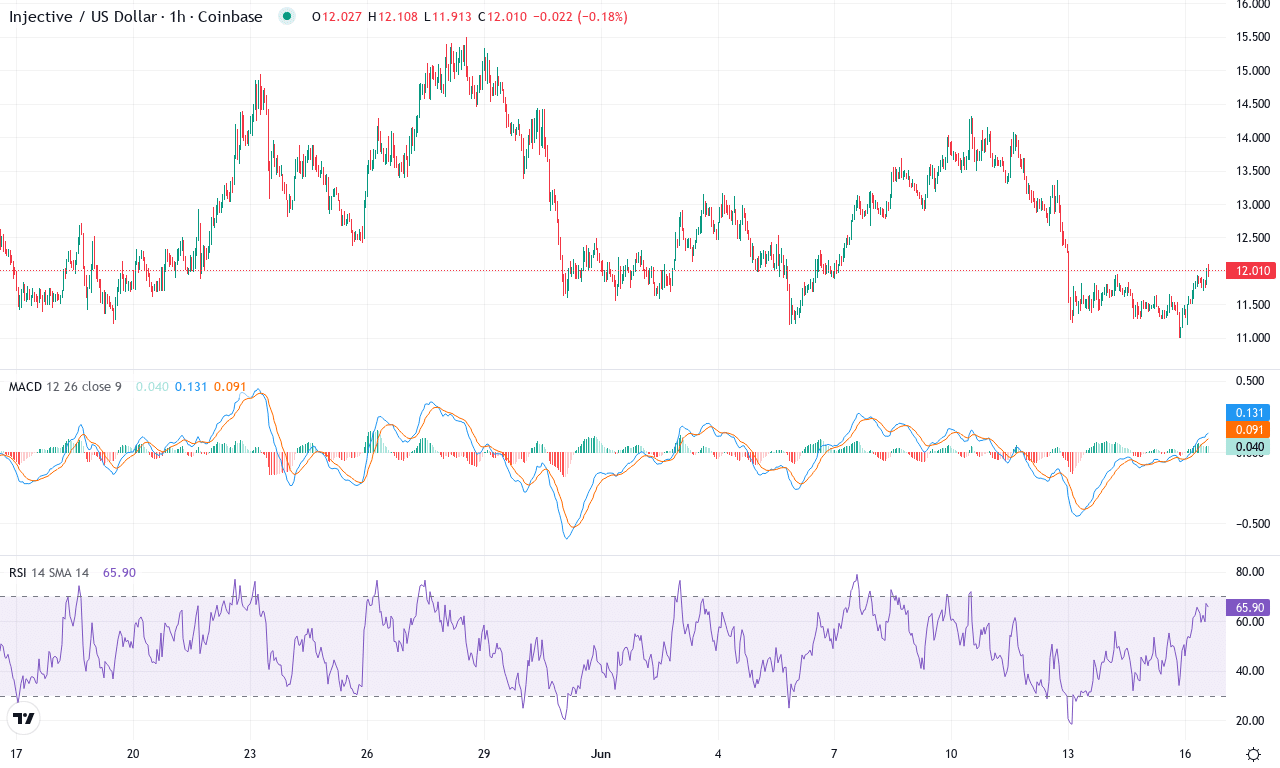
| Crypto | Close | 1W% | 1M% | RSI | ADX | MACD | CCI 20 | INJECTIVE(INJ) | $12.10 | -8.85% | 1.18% | 47.8 | 18.2 | -0.08 | -71.47 |
|---|
After a bruising six-month decline, Injective is finally flashing subtle signs of stabilization, even as it battles substantial headwinds. This past week saw a modest rebound, but the token remains mired deep in negative territory compared to its yearly peak—a stark reminder of 2024’s volatility. Still, with prices bouncing off a monthly low near $11 and closing just above $12, the market appears to be consolidating within a broad range, setting traders on edge as anticipation builds for the next directional move. While the monthly performance barely budges positive, that 21% three-month pop suggests fresh buyers may be lurking. I’m watching this coil of energy closely—my instinct says a decisive break is coming soon.
Delving into the technical landscape, trend indicators are perking up: the ADX has climbed into a region hinting at strengthening trend, while the positive DI is attempting to overtake its negative counterpart, indicating bulls are regaining some control. The weekly MACD continues to inch away from its lows, although it has yet to issue a full-throated buy signal. Simultaneously, oscillators are inching higher, with RSI in the mid-40s—suggesting the market is neither overbought nor oversold but poised for a push. Price is hovering just above the closely clustered moving averages, a classic setup where breakout momentum could ignite quickly. I see $13.30 as initial resistance; clear that zone and we could test the psychologically-charged $15.50 monthly high. However, if sellers reappear and push price below support at $11.60, risks of an extended fall down toward the $10.00 region intensify. Personally, I’m wary of the recent profit-taking, but a strong resistance break would be impossible to ignore. For now, all eyes are on volume—if it swells, get ready for fireworks.
Will Bears Tighten Their Grip or Will Bulls Snap Back?
Bitcoin SV remains at a crucial juncture, struggling to find footing post-decline, while Zcash’s battle with $50 defines its current trajectory. Meanwhile, Injective’s consolidation pattern hints at a potential move, leaving traders poised for either a breakout or breakdown. With the market’s path still unclear, the next few sessions could illuminate the prevailing trend.