Chainlink And Avalanche Hang In The Balance As Bears Tighten Grip On Make-Or-Break Support
Recent market turbulence has put Chainlink and Avalanche at a critical juncture, as bears tighten their grip on both assets. Despite managing to cling onto crucial support levels, the absence of bullish momentum raises concerns about potential breakdowns. With price pressure near psychological thresholds, the coming days could tell whether bulls can stave off further declines or if bears will assert deeper control. Let’s break down the technical setup across the board.
Chainlink (LINK) Price Analysis
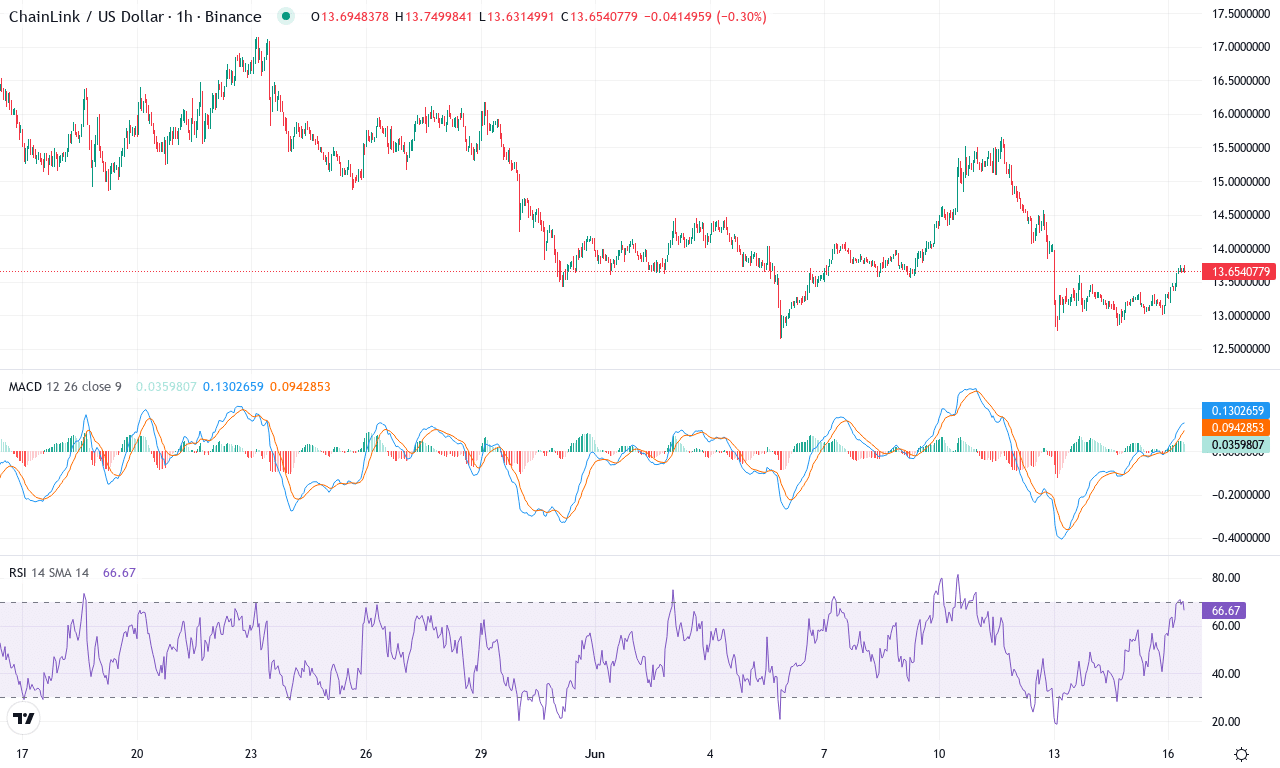
| Crypto | Close | 1W% | 1M% | RSI | ADX | MACD | CCI 20 | CHAINLINK(LINK) | $13.64 | -0.72% | -13.48% | 44.4 | 19.8 | -0.39 | -63.97 |
|---|
Chainlink has endured a turbulent month, with its price tumbling over 13% in June and extending a deeper, bruising 51% pullback over six months. After a prolonged slump from its highs near $17, LINK is clinging to support above $13.60, refusing to break down completely, but momentum remains weak. The sharp correction has pushed sentiment to a cautious low, and the technical outlook suggests traders are still struggling to regain confidence—especially with bullish momentum so noticeably absent. As altcoin markets wobble, LINK’s failure to find a reliable bid is worrying; in my view, bears have seized control of the short-term narrative, and risk of a steeper fall lingers unless buyers make a definitive stand soon.
Diving into the charts, the strength of the downtrend comes through loud and clear: trend indicators show bears firmly in the driver’s seat, and the weekly MACD remains negative with no clear sign of reversal brewing yet. Chainlink trades well below key short- and medium-term moving averages, underlining how far sentiment has slipped since April. Oscillators continue to show sluggish recovery—RSI remains subdued and, while not fully oversold, certainly hints at exhaustion among bulls. The price is currently wedged just above crucial support at $13, with resistance looming at $15; if sellers drive LINK below this support, risks extend toward the $12–$10 zone in a hurry. However, a strong bounce here—backed by a shift in momentum oscillators or a pronounced uptick in volume—could see a rally targeting the $15 and even $17 resistance ceilings. I’d love to see bulls step in aggressively, but with trend signals as soft as they are now, traders should beware false starts and keep stops tight—at least until the technicals signal a genuine reversal is on deck.
Avalanche (AVAX) Price Analysis
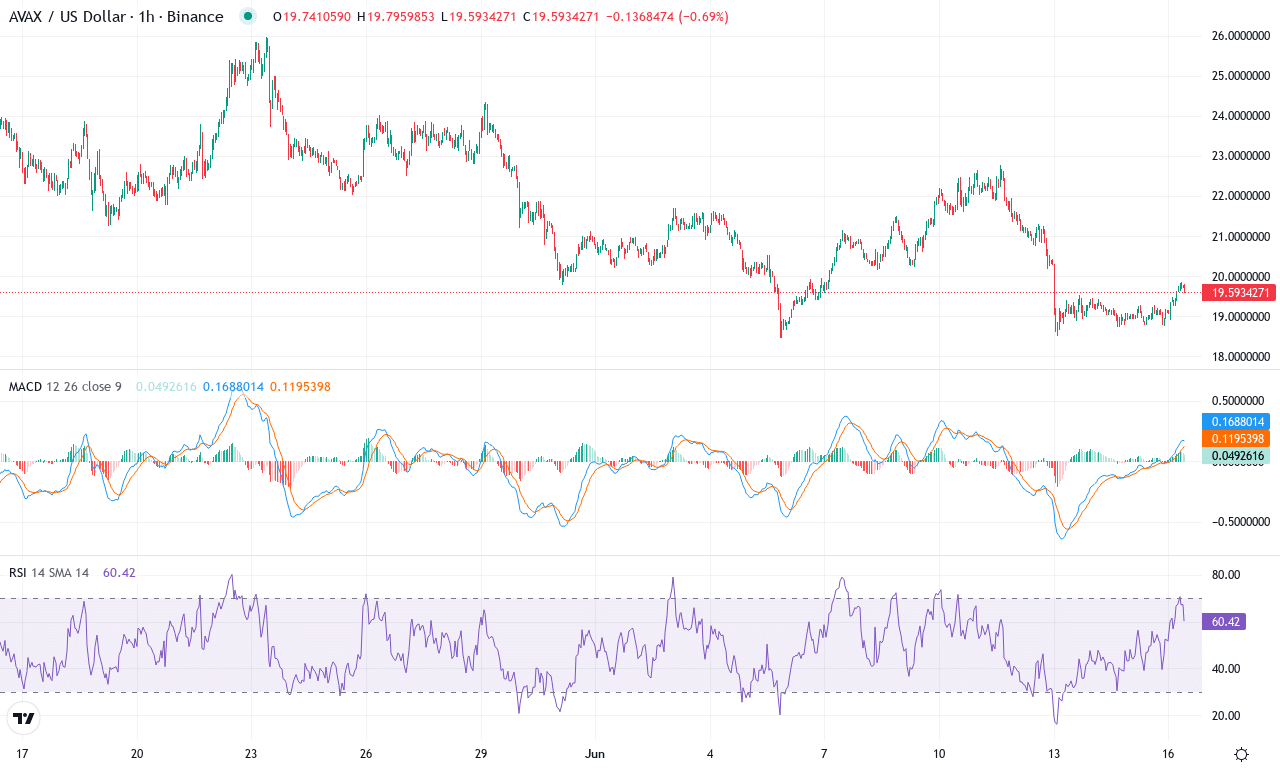
| Crypto | Close | 1W% | 1M% | RSI | ADX | MACD | CCI 20 | AVALANCHE(AVAX) | $19.63 | -6.69% | -14.83% | 42.8 | 16.4 | -0.68 | -90.01 |
|---|
After experiencing relentless downside over the past month, Avalanche is struggling to stabilize, with the price down nearly 15% in the last 30 days and trading close to $19.60. Short-term sentiment feels shaky—weekly losses deepen the bearish mood and long-term performance trails the market badly, down more than 50% in the last six months. AVAX’s failure to hold earlier support zones is fueling concern among traders that further capitulation could be ahead. Frankly, it’s been painful to watch, but periods like this often set up the next big move. The broader technical outlook still leans negative, especially with the coin hovering well below its major moving averages and failing to muster any convincing bounce from this month’s lows near $18.40.
The deeper technical read underscores Avalanche’s vulnerability: trend signals are picking up strength but pointing the wrong way—the directional indicators show sellers are firmly in control, and oscillators confirm momentum is still headed south. The MACD sits distinctly in bearish territory and weekly signals show lingering downside pressure, while the RSI and Ultimate Oscillator are both hovering in oversold zones, which should put bulls on alert for a relief rally, but so far buyers lack the conviction to flip the script. Price action lags below every significant exponential average and even the Hull Moving Average, reinforcing the risks of an extended fall. For scenario planning: if Avalanche can reclaim resistance around $22.20 and close above its key pivots, we could see short covering spark a swift move toward $25.90—but failure to hold $18.40 risks triggering another sharp drop toward the psychological $15 neighbor. Sellers have the upper hand here, but I’m keeping my eyes peeled—if this market stages a surprise bounce, I want to be ready.
Bulls’ Last Stand?
Chainlink is barely holding its support at $6, while Avalanche teeters on the $13 level. Without a resurgence in buyer interest, sustained pressure could lead to significant declines for both. Traders are watchful, as any sign of bullish reversal or bear dominance will determine the direction of the next move.