Chainlink DeepBook Protocol and Fartcoin Test Make-or-Break Support as Bulls Face Relentless Bear Pressure
After recent bouts of aggressive market activity, Chainlink has closed above $13, contending with formidable resistance just above. Meanwhile, DeepBook Protocol’s sharp correction highlights underlying volatility, with its price now flirting with pivotal support levels. As for Fartcoin, its colossal rally met a formidable wall and has since tumbled, facing critical near-term supports. With such dynamics in play, traders are on edge: will these assets find footing, or is more turbulence on the horizon? Let’s break down what the key indicators are suggesting now.
Chainlink (LINK) Price Analysis

| Crypto | Close | 1W% | 1M% | RSI | ADX | MACD | CCI 20 | CHAINLINK(LINK) | $13.10 | -15.11% | -17.44% | 40.8 | 18.3 | -0.46 | -108.94 |
|---|
After a turbulent month marked by aggressive swings, Chainlink has struggled to recapture its former bullish momentum, closing just above the $13 mark—a far cry from its monthly high above $17. Heavy selling over the past week has left LINK down more than 15%, erasing much of its earlier 2024 gains. It’s been a tough stretch for the bulls; the persistent downward pressure is underscored by a sharp, nearly 43% decline over the last six months—plenty of ammunition for the bears. As Chainlink languishes at the lower end of its recent trading range, traders are watching with bated breath: will sellers extend this steep correction, or is a relief bounce in sight?
Diving into the technicals, the outlook remains clouded with risk. Trend indicators show LINK in the grip of bearish momentum: the weekly MACD continues to run negative, signaling that any attempts at recovery lack real conviction for now. Oscillators reinforce this cautious tone; the RSI lingers in neutral territory, confirming the absence of strong buying interest, while negative readings on other momentum gauges imply sellers still have the upper hand. Chainlink trades below its key short-term moving averages—another classic bear-market sign—meaning even a minor rally could run into stiff resistance around the $15 psychological zone. Immediate support sits precariously near $12; if that cracks, we could see a swift move lower, perhaps even a volatility surge toward $10. However, should the bulls reclaim $15 and push above the $17 resistance, a more sustained recovery might ignite. For now, caution is king. I’m not hitting the panic button yet, but a decisive break below $12 would definitely have me rethinking my thesis.
DeepBook Protocol (DEEP) Price Analysis
| Crypto | Close | 1W% | 1M% | RSI | ADX | MACD | CCI 20 | DEEPBOOK PROTOCOL(DEEP) | $0.13 | -21.74% | -28.64% | 38.6 | 19.0 | -0.01 | -133.51 |
|---|
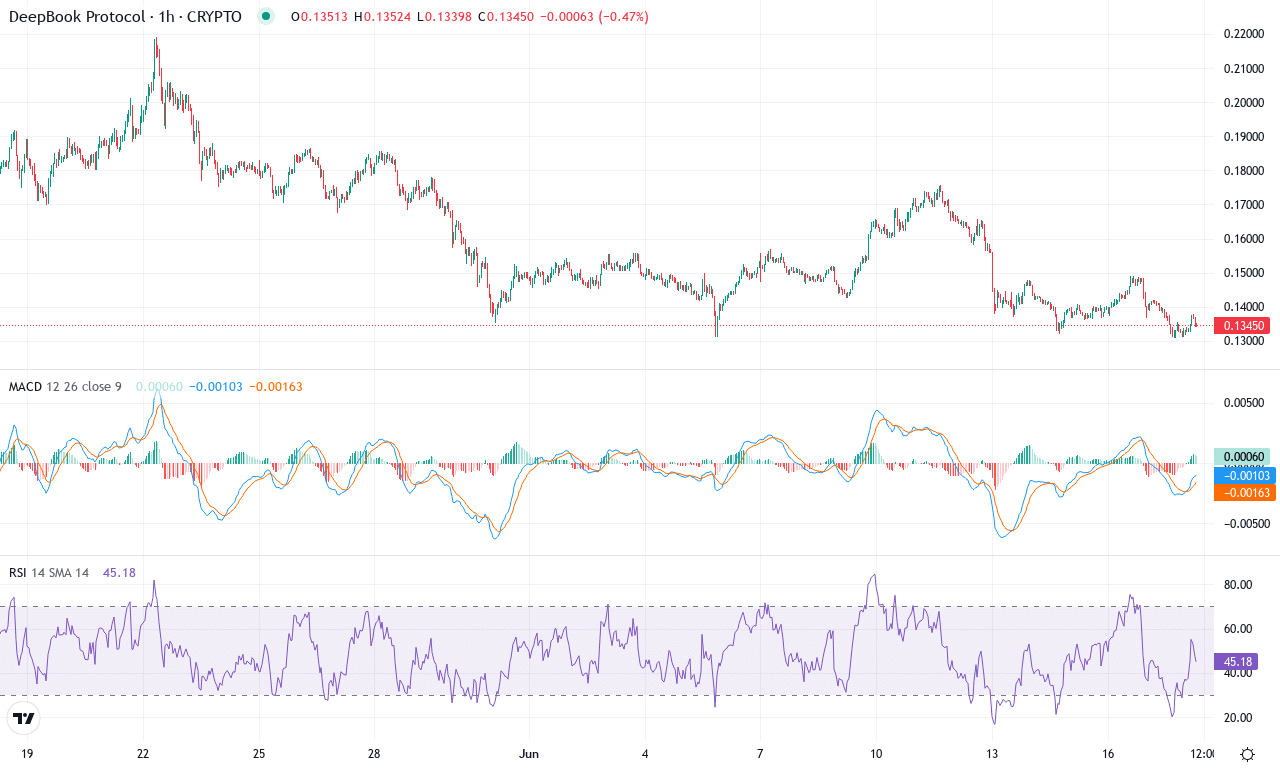
After a spectacular spring rally, DeepBook Protocol (DEEP) has endured a notable correction, shedding over 28% in the past month and dropping just below the $0.14 mark. This reversal comes on the heels of a massive three-month run that saw gains above 56%, so some could argue a cooling-off period was overdue. The recent volatility hasn’t gone unnoticed—traders saw a steep fall from the $0.22 monthly high to a $0.13 low, with prices currently consolidating at a level that coincides with the 10- and 20-day exponential moving averages. The broader trend, however, remains constructive given DEEP’s extraordinary year-on-year gains of nearly 2,600%. As DEEP pivots here, the price action feels tense—will buyers regain control, or is a deeper retracement on deck?
The technical outlook suggests we’re at a crossroads. Trend indicators remain elevated, reflecting underlying bullish momentum, but the negative divergence between the current price action and fast-dropping oscillators—like the Commodity Channel Index plummeting to deeply oversold territory—signals that sellers are gaining traction. The weekly MACD has rolled over into negative territory, corroborating the pullback and potential for further profit-taking. Yet, DEEP is holding just above major support near $0.13, a zone that also aligns with the middle pivot and a recent cluster of moving averages. If buyers can defend this pivotal level and push back above $0.17, a renewed uptrend could kick off, with resistance at $0.20 the next logical target; otherwise, failure here may trigger a steep correction toward $0.11. I’m watching this standoff closely—if bulls don’t show up soon, risks of an extended fall are real. Sometimes, the hardest part is waiting for conviction, but discipline here could make all the difference.
Fartcoin (FARTCOIN) Price Analysis
| Crypto | Close | 1W% | 1M% | RSI | ADX | MACD | CCI 20 | FARTCOIN(FARTCOIN) | $1.10 | -20.74% | -19.03% | 45.6 | 16.2 | -0.01 | -22.72 |
|---|
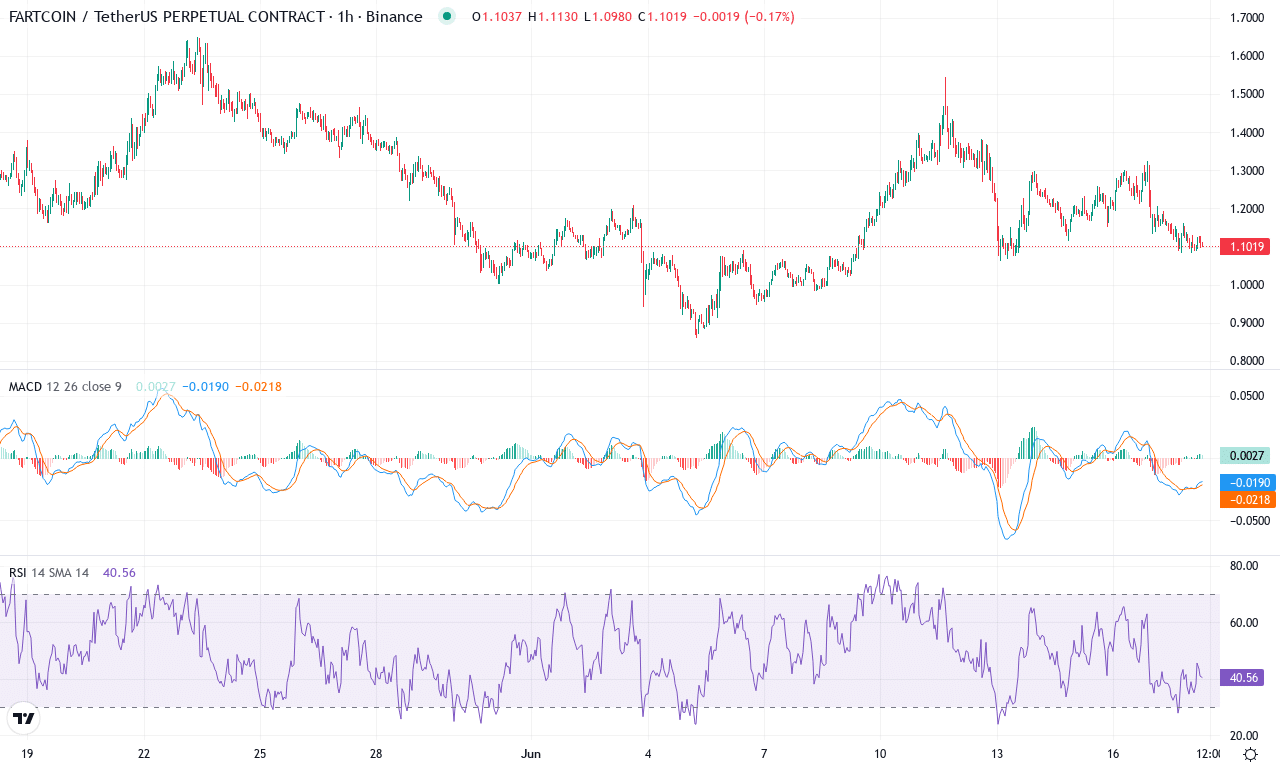
After rocketing over 170% in the last quarter, Fartcoin has slammed into a steep correction, diving nearly 21% from its monthly peak and shedding another 19% in just the past month. The current week hasn’t provided any respite either, with more than 20% wiped off in rapid succession, underscoring the sheer volatility coursing through this name. All eyes are on Fartcoin’s technical posture as it clings to the lower end of its monthly range, currently trading around $1.10—unmistakably closer to its recent low than that euphoric $1.65 high. As speculation and high-beta sentiment fade, the technical outlook suggests that bullish momentum is waning, and risks of an extended fall loom unless buyers stage a heroic comeback at support.
Drilling into the details, trend indicators show the uptrend’s authority is under siege—while Fartcoin still registers elevated trend strength, the directional lines have flipped hostile, hinting bears are regaining control. The MACD, after signaling upside in prior weeks, now flattens and threatens a bearish cross as its histogram stagnates. Oscillators echo this caution: momentum readings have turned negative, CCI has plummeted into deeply oversold terrain, and the RSI, while not in official panic territory, has cooled off substantially from prior exuberance. Notably, price sits below all key short-term moving averages and is hovering precariously above the next critical support around $1.05. If sellers force a breakdown through this zone, I’d expect a brutal flush toward the psychological $1.00 mark—painful, but possibly cathartic. On the flip side, if buyers can muscle Fartcoin back above the $1.22–$1.25 resistance cluster, a reversal could spark swift short covering and push prices back toward $1.40. Until then, traders beware—momentum is fickle, and in this kind of turbulence, you’re not underwater until you hit that sell button.
Navigating Critical Support Levels
Chainlink’s ability to maintain levels above $13 suggests underlying strength, but breaking the resistance ahead remains a challenge. DeepBook Protocol teeters on its make-or-break support, hinting at potential bearish continuation if buyers do not intervene. Fartcoin’s recent plunge places it on a decisive edge; a failure to hold could spell further declines. The coming sessions will be crucial in determining whether these assets stabilize or succumb to persisting bearish pressures.