DeXe, Quant, Trump, and Bittensor Hover at Critical Inflection Zones as Bears Tighten Grip—Will Bullish Reversals Emerge or Deeper Selloffs Await?
In an atmosphere thick with uncertainty, DeXe, Quant, Trump, and Bittensor hover at critical inflection points, where bullish hopes collide with bearish momentum. With DeXe attempting to stabilize after a volatile 28% plunge, and Quant eyeing a recovery from its recent drawdown with a burgeoning 29% rally, the stakes are high. Across the board, key support and resistance levels loom large as technical indicators wrestle to dictate the next direction. Will these assets find the spark for upward reversals or are deeper corrections in store? Let’s break down the technical setup across the board.
DeXe (DEXE) Price Analysis
| Crypto | Close | 1W% | 1M% | RSI | ADX | MACD | CCI 20 |
|---|---|---|---|---|---|---|---|
| DEXE (DEXE) | $10.47 | -25.13% | -27.89% | 38.6 | 31.2 | -0.85 | -96.26 |
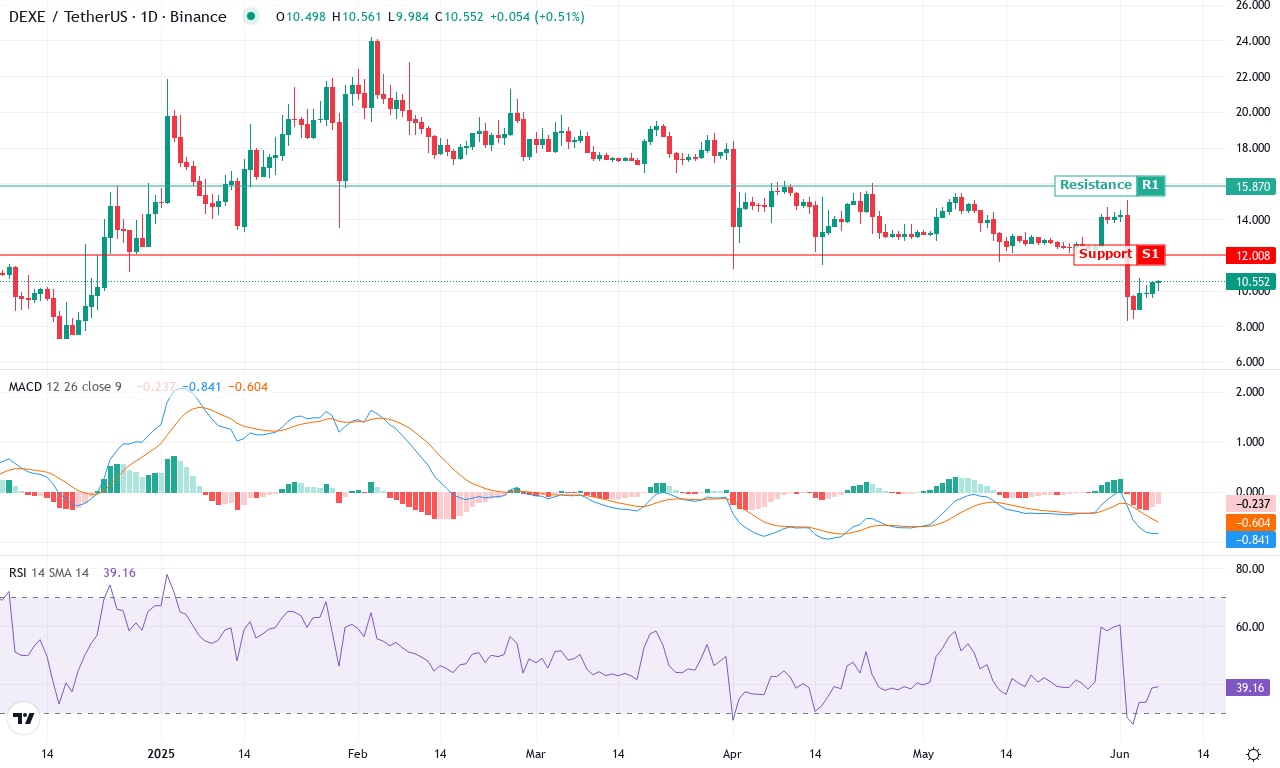
After a brutal month that saw DeXe plummet nearly 28%, the token is clawing for stability just above $10.50. The high-to-low swing this month touched a staggering 45%, underlining a volatility surge that’s shaken out weak hands. Traders have felt the sting—three-month returns are down nearly 44%, and the bears have kept momentum on their side despite a modest attempt at bottom-fishing in recent sessions. With several moving averages now flattening out and price action clinging to a precarious ledge above the monthly low at $8.29, DeXe looks like it’s caught between aggressive profit-taking and tentative dip buyers circling for bargains. Personally, the whipsaw has been exhausting—this is classic capitulation, but capitulation often births opportunity.
Diving into the technicals, trend indicators are still flashing warning lights: The ADX holds above 30, confirming a strong prevailing trend, and it’s the bears who are pressing—negative directional readings remain dominant, echoing through oscillators that show lingering downside pressure. The weekly MACD’s slow deterioration, with an uninspiring crossover, further saps bullish conviction, even as the shorter-term histogram hints at waning sell momentum. RSI hovers around the low 40s, not screaming oversold but certainly shy of any real bounce-back energy. DeXe flirts with layered support at $10.00 and $8.30—crucial psychological zones. If sellers force a daily close beneath $8.30, the risks of a steep correction into the low $6s rise sharply. On the flip side, a decisive breakout above the $12.00–$13.70 cluster (where key exponential moving averages and resistance levels converge) could catalyze a much-needed trend reversal, with $15.00 serving as the next major target. Right here, there’s tension in the chart—wait for confirmation, and don’t get lulled into complacency. This is a knife’s edge for DeXe.
Quant (QNT) Price Analysis
| Crypto | Close | 1W% | 1M% | RSI | ADX | MACD | CCI 20 |
|---|---|---|---|---|---|---|---|
| QUANT (QNT) | $115.95 | 9.68% | 28.83% | 63.4 | 33.4 | 6.18 | 90.39 |
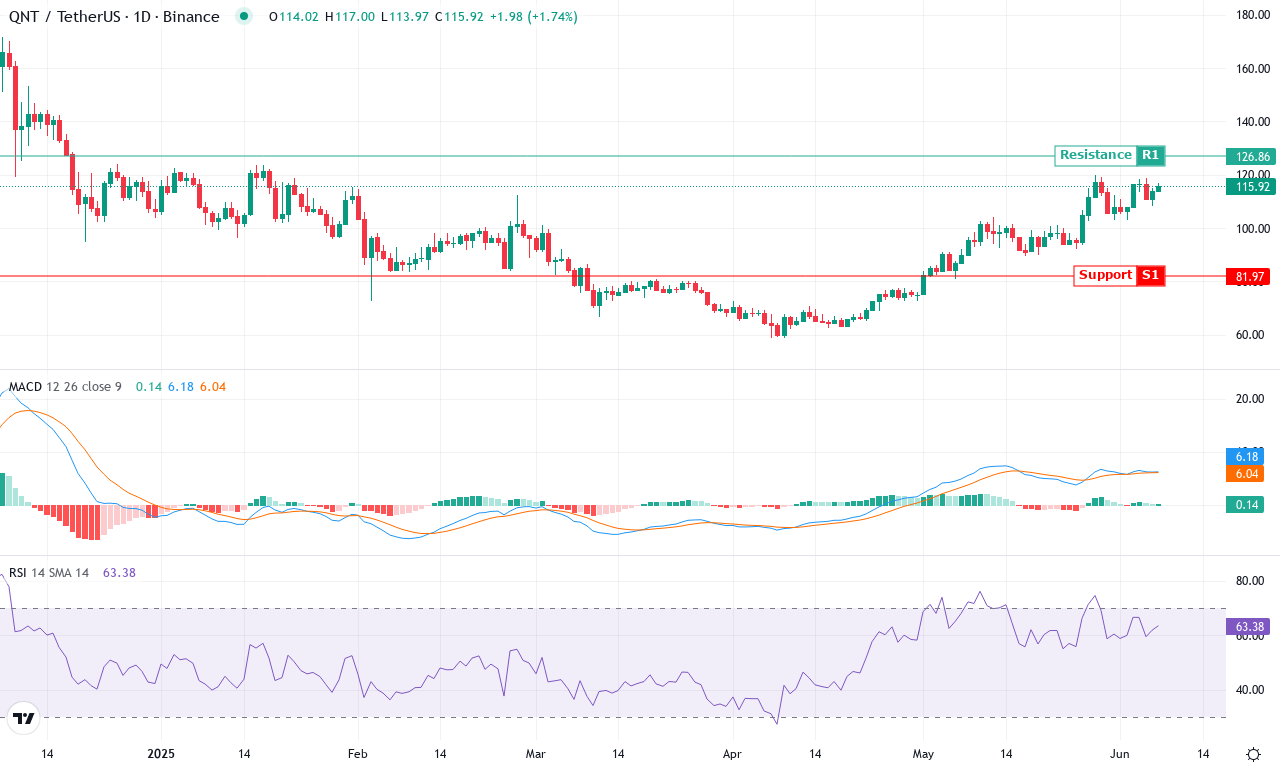
After a turbulent six months marked by a sharp -28% drawdown and wild price swings, Quant (QNT) is clawing its way back into the spotlight with a robust 29% rally in the past month. Long-term trend followers can’t help but note the impressive turnaround after Quant bounced from its monthly low of $89.52 to close at $115.95—hovering just beneath its monthly high. This resurgence isn’t just a flash in the pan, either. With a three-month gain above 36%, the technical outlook suggests that bullish momentum is regaining control, even as some investors may still be haunted by the ghosts of last quarter’s steep correction.
Digging deeper, the trend indicators are unambiguous—strength is building. The Average Directional Index surges above 33, signaling a maturing bullish phase, while positive directional movement far outpaces the negative. More importantly, the MACD line sits comfortably above its signal on both weekly and daily frames, and oscillators like the Awesome Oscillator and RSI swell with enthusiasm. With Quant currently riding above all key short- and long-term exponential moving averages, the technical foundation is solid. All eyes are now on resistance near $126, where a breakout could pave the way toward the recent $145 and even $190 swing highs. But if sellers capitalize on profit-taking at these levels, expect bids to hold firm around $100—a psychologically charged and well-tested support zone. If bulls can clear $126 decisively, the stage is set for a volatility surge; otherwise, don’t be surprised by a brief cooldown. As for me, I’m excited—when trend and structure align this perfectly, the only question is: how far can the bulls run before the next pullback?
Official Trump (TRUMP) Price Analysis
| Crypto | Close | 1W% | 1M% | RSI | ADX | MACD | CCI 20 |
|---|---|---|---|---|---|---|---|
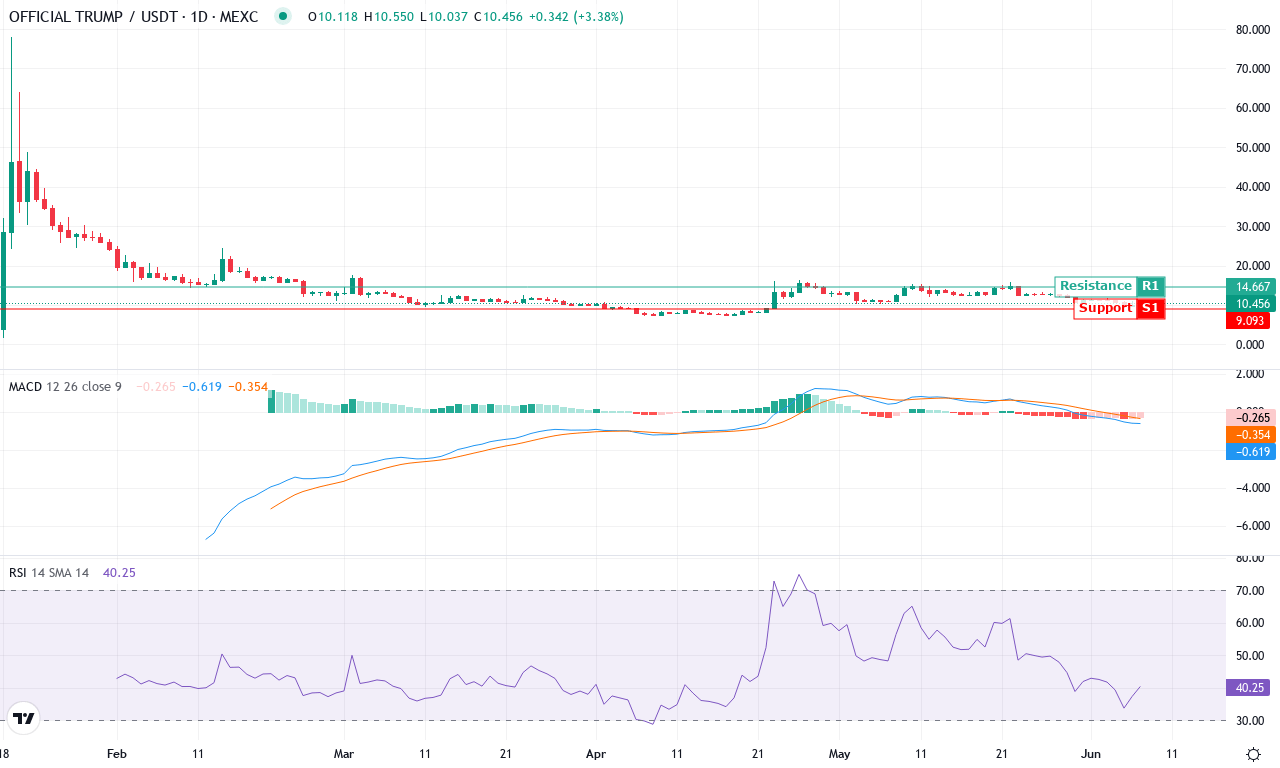
| OFFICIAL TRUMP (TRUMP) | $10.43 | -3.68% | -5.04% | 40.0 | 18.8 | -0.62 | -102.85 |
After an explosive 6-month rally that saw OFFICIAL TRUMP skyrocket over 170%, the token is facing palpable headwinds. This month’s price action paints a tale of two markets: a steep correction has pulled TRUMP down more than 5% for June, and it’s given up over 13% since its local high—clearly, bullish momentum is cooling. The coin tumbled straight through mid-May support, closing the week at $10.43, and while early investors may still be deep in profit, the technical outlook now hints at a shift in sentiment. Under the surface, trend indicators are flagging vulnerability as volatility surges—every sharp move has traders on edge. Personally, I’m not throwing in the towel yet, but it’s definitely time to stay nimble as sellers regain the upper hand.
Drilling deeper, a rising average directional index underscores the current trend’s strength, yet the negative directional reading outpaces positive by a wide margin—clear warning bears are in control for now. The weekly MACD shows continued divergence below its signal, and oscillators remain mired in negative territory, pointing to persistent downward momentum. TRUMP is also trading well beneath its recent moving average cluster, with price slipping below the 10-, 20-, and 30-day EMAs—a classic signal for risk of an extended fall. Immediate resistance looms near $12.50, and unless the bulls stage a decisive breakout here, the door is open for a further retest of the psychological $9.00 support zone. If that level fails, downside could accelerate fast, especially if long liquidations start stacking up. However, a close above $12.50 would invalidate the bearish thesis and reawaken the bulls. Stay alert—these are make-or-break days for TRUMP, and I wouldn’t be surprised to see volatility ramp even higher.
Bittensor (TAO) Price Analysis
| Crypto | Close | 1W% | 1M% | RSI | ADX | MACD | CCI 20 |
|---|---|---|---|---|---|---|---|
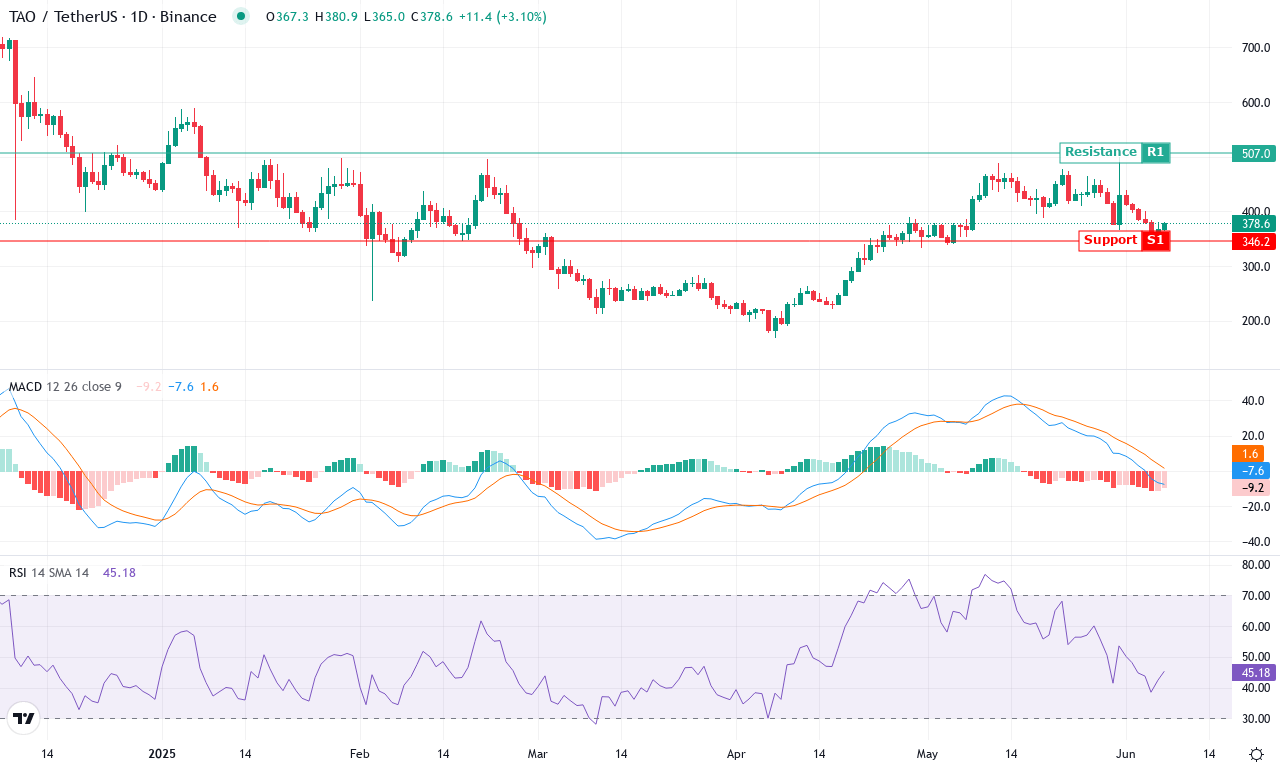
| BITTENSOR (TAO) | $377.60 | 0.27% | 2.61% | 45.0 | 19.7 | -7.71 | -115.79 |
Bittensor (TAO) has delivered a turbulent month, retreating sharply from its $500 monthly high to stabilize near $377.6 as sellers regain control. While the weekly chart shows a mild rebound, Bittensor’s mid-term slide—down over 47% in six months—fuels a cautionary mood. After a period of explosive gains earlier this year, momentum has clearly shifted; technical outlook now suggests that lingering bearish forces are kneecapping any persistent rallies. The price action clings just above several key moving averages, but the tape tells a story of heavy profit-taking and weak dip demand. As headwinds mount, I can’t help but feel wary here—no shame in closely managing risk.
Drilling into the technicals, trend indicators highlight a complex battle: while the ADX registers strong directional conviction, bearish strength edges out the bulls, hinting that sellers are still steering this market. The MACD line sits below its signal and points south—a classic precursor to deeper downside. Oscillators reinforce this posture: stalling momentum and a suppressed Awesome Oscillator suggest any bullish reversal will face stiff headwinds. RSI hovers in no-man’s land, validating the lack of conviction, while price action hovers near the $370–$385 band—barely above the 200-day average but ominously close to psychological support at $350. Should bears break below $346, Bittensor risks an extended fall toward $262; however, clearing $400 on impressive volume would invalidate the bearish thesis and open a path back to $500. For now, volatility remains high and the burden of proof is on the bulls—traders, stay nimble.
Inflection Points Ahead
DeXe seeks footing amidst recent volatility, while Quant’s potential recovery hints at trading opportunities if resistance is surpassed. Trump and Bittensor remain at crossroads, gathering momentum for possible directional shifts. Traders should brace for pivotal moves, staying alert to key levels that could signal the next phase in both assets’ trajectories.