DeXe Sinks Toward Capitulation as Quant Eyes Breakout—Will Diverging Fortunes Trigger the Next Big Move?
DeXe is grappling with a staggering three-month drawdown, testing key support levels around $8.30 amid waning bullish momentum. Traders are left pondering if this marks the bottom or if further losses loom on the horizon.
DeXe (DEXE) Price Analysis
| Crypto | Close | 1W% | 1M% | RSI | ADX | MACD | CCI 20 |
|---|---|---|---|---|---|---|---|
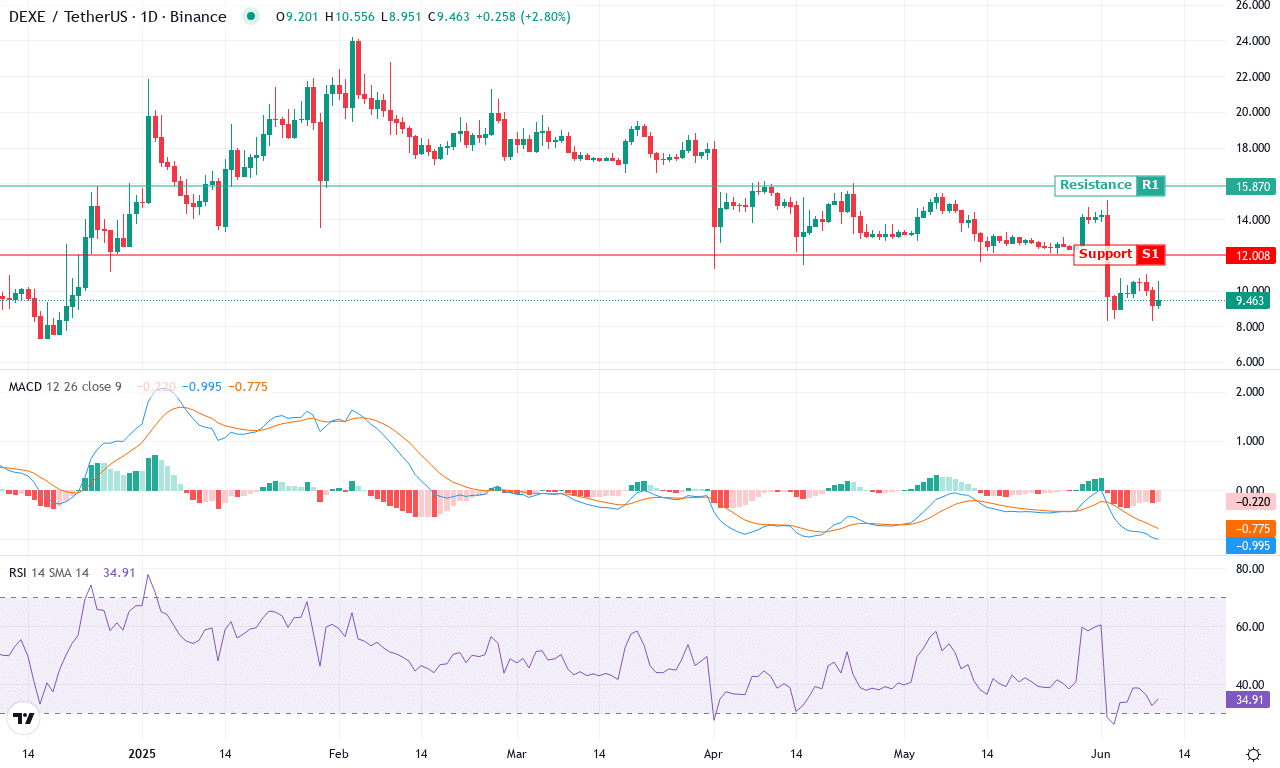
| DEXE (DEXE) | $9.29 | -4.11% | -32.79% | 33.4 | 31.3 | -1.01 | -88.84 |
After a bruising month where DeXe (DEXE) plunged nearly 33% and chalked up a staggering 47% drawdown over three months, the token finds itself clawing for stability around $9.30. This dramatic slide from June’s high has traders rattled, especially with DEXE posting a weekly loss just north of 4%. The larger backdrop paints a picture of fading bullish momentum and shaky investor sentiment; not even institutional flows seem able to arrest the freefall. Yet, with the price testing multi-month lows near $8.30 and tracing a tight range against a backdrop of heavy volatility, there’s a whiff of exhaustion among sellers—perhaps a moment where capitulation could hand the baton to brave bottom-pickers.
Digging into the technicals, the strength of the prevailing downtrend is undeniable—trend indicators remain firmly bearish, and the weekly MACD suggests little hope for an immediate reversal. Oscillators, including momentum and the Commodity Channel Index, hover deep in negative territory, making it clear that sellers are still in command. However, the ADX—registering a robust reading—also hints the trend is well-established but may soon become overextended if exhaustion grows. DEXE is below all major moving averages, with the 10-day EMA acting as a near-term ceiling; only a decisive push above this zone (around $10.30) would signal bulls are regaining control. On the flip side, if $8.30 cracks, risks of an extended fall are real, with the next support visible near the psychological $8. Through all this, sentiment is skittish—if you’re holding, remember: you’re not in the red until you sell, but don’t ignore the warning signs flashing on the charts.
Meanwhile, Quant has surged over 20% this month, challenging notable resistance zones and hinting at a potential breakout. Will diverging paths create the next major pivot in market dynamics? Let’s break down the technical setup across the board.
Quant (QNT) Price Analysis
| Crypto | Close | 1W% | 1M% | RSI | ADX | MACD | CCI 20 |
|---|---|---|---|---|---|---|---|
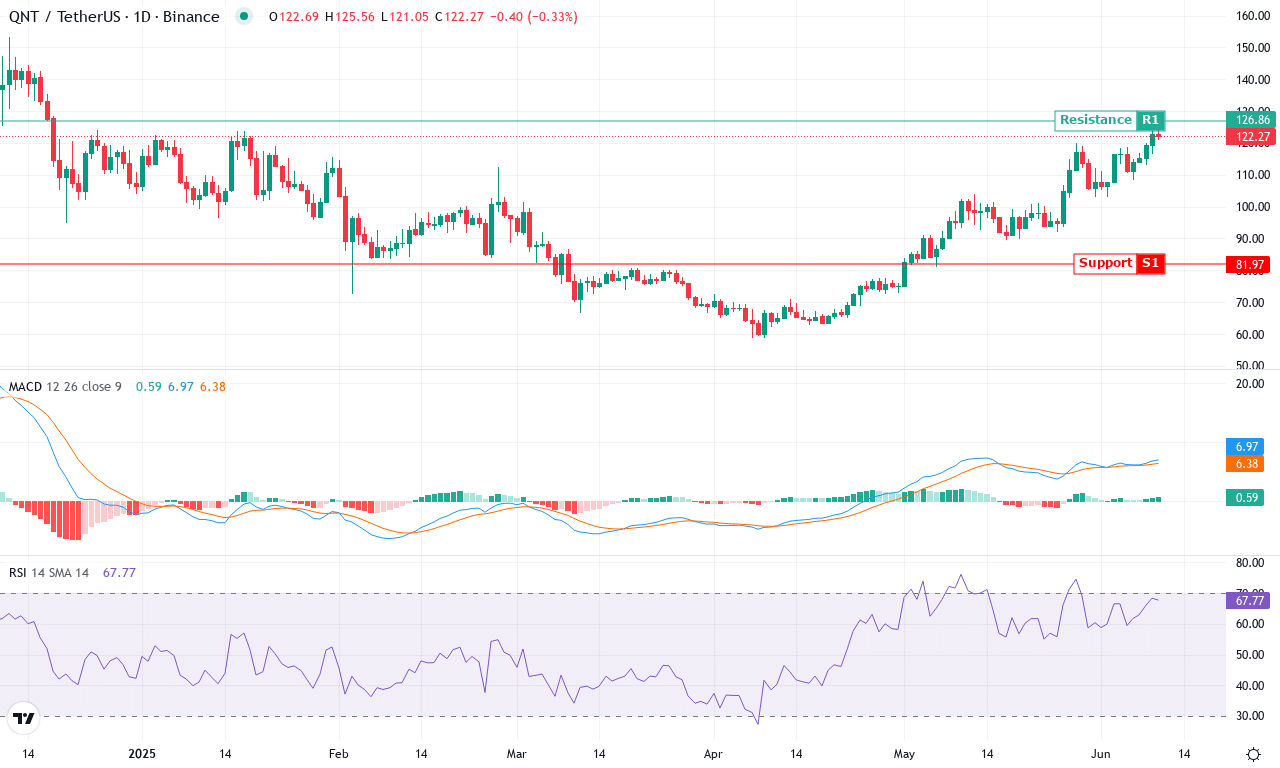
| QUANT (QNT) | $122.64 | 13.73% | 20.59% | 68.3 | 34.0 | 7.00 | 131.12 |
After spending much of the past quarter in a jagged but upward-sloping channel, Quant (QNT) is finally flexing its muscles. The token surged over 20% in the last month, outperforming many large-cap peers, while this past week alone marked a strong 13.7% push that caught the eye of traders hunting for momentum leaders. QNT’s ability to rally from its monthly low near $89 to close at $122.64 signals robust dip buying and hints at institutional inflows. After six months of lagging and negative performance, this sudden change in character raises the question: are bulls finally regaining control, or is this just another overdue spike before bearish pressure resumes? With yearly performance back in the green—almost 40%—it’s hard not to feel a bit of excitement building, but volatility risk remains elevated.
Technically, QNT is throwing off bullish signals rarely seen in recent months. The trend indicators have strengthened, with the ADX pointing to trend expansion and positive directional strength clearly dominating over negative. The weekly MACD shows renewed acceleration, supporting a medium-term bullish thesis, while momentum oscillators are swelling and the RSI is confidently above 65, without signaling extreme overbought territory just yet. Price action has leapt above the major moving averages—the 10, 20, and 50 EMA clusters are now support, not resistance—suggesting a foundational trend shift. QNT is now eyeing a stiff resistance zone near $145; breakout momentum above this level could spark a swift move toward the $170–$190 range. But if bulls fail and profit booking intensifies, look for a healthy pullback toward $100—where moving averages and a psychological round number converge. Personally, I’d be thrilled to see $145 taken out decisively, but I’m keeping stop orders tight; after all, risk management is everything in these fast-moving markets.
Will Diverging Paths Define the Market’s Next Phase?
DeXe is teetering on crucial support at $8.30, with traders cautious of a further downward slide, while Quant’s recent surge confronts resistance, indicating a possible breakout. If DeXe stabilizes and Quant confirms the rally, we could see a shift in market sentiment. As both coins test critical junctures, traders should brace for significant movements, either solidifying current trends or reversing course.