
EOS Stares Down Breakdown While BCH and UNI Bulls Test Breakout Nerve Amid Mounting Volatility
After a rough month with EOS sliding over 35%, traders are on edge as the coin hovers near its recent lows, signaling potential turbulence ahead. Meanwhile, Bitcoin Cash has surged 16% in the past week, reigniting hopes for a sustained rally as it presses against key resistance levels. Uniswap has also caught traders’ attention with a 25% monthly gain, suggesting a possible bullish breakout as it approaches critical price zones. The question remains: will these digital assets continue their upward momentum or face downward pressure? Let’s take a closer look at the signals behind the move.
EOS (EOS) Price Analysis
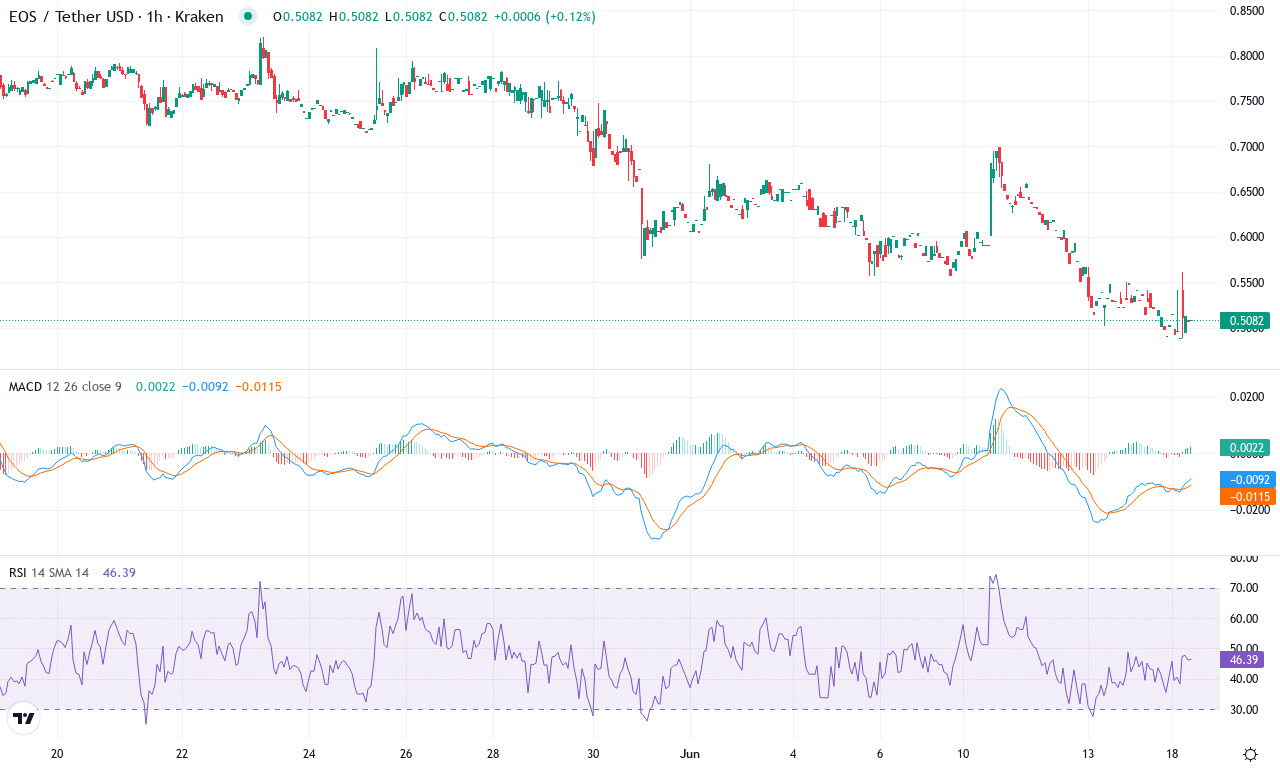
| Crypto | Close | 1W% | 1M% | RSI | ADX | MACD | CCI 20 | EOS(EOS) | $0.51 | -8.56% | -35.55% | 33.0 | 19.7 | -0.05 | -123.02 |
|---|
After a devastating month that saw EOS tumble over 35%, the coin is now hovering just above its recent monthly low, sending jitters through even seasoned traders. The last seven days saw another bruising decline, extending the pain from what’s already been a brutal six-month stretch for EOS. The technical outlook suggests that sellers are still firmly in control, but with prices consolidating near $0.50—a region that has historically attracted bargain hunters—the stage is set for a high-stakes showdown between bulls and bears. If we see a volatility surge or a sharp reversal, sentiment could shift swiftly; otherwise, risks of an extended fall remain top of mind. Myself, I’m watching this zone with a mix of dread and anticipation—breakdowns from here often trigger long liquidations and cascade events.
Diving into the technicals, trend indicators continue to point lower. The average directional index reveals a strong trend, with negative momentum swelling as the positive directional component trails behind. The MACD histogram is deep in the red, suggesting that bearish momentum remains unchallenged, while the weekly MACD line confirms this by sitting well beneath its signal. Oscillators, including RSI, reflect an oversold environment, but there’s little sign yet of a true bullish divergence or reversal setup—a classic dead-cat bounce could entice traders, but conviction is lacking. Price action analysis reveals that EOS is pinned beneath all major moving averages and is struggling to reclaim even the nearest short-term EMA, a clear sign that sellers are still getting the upper hand. Key support lies in the $0.48 zone; a slip below there risks a steep correction toward $0.40. However, if bulls muster enough strength to push EOS back toward $0.73—the middle pivot area—a breakout rally could materialize. Until we see a decisive move, caution reigns supreme; jump in too soon, and you might just catch a falling knife.
Bitcoin Cash (BCH) Price Analysis
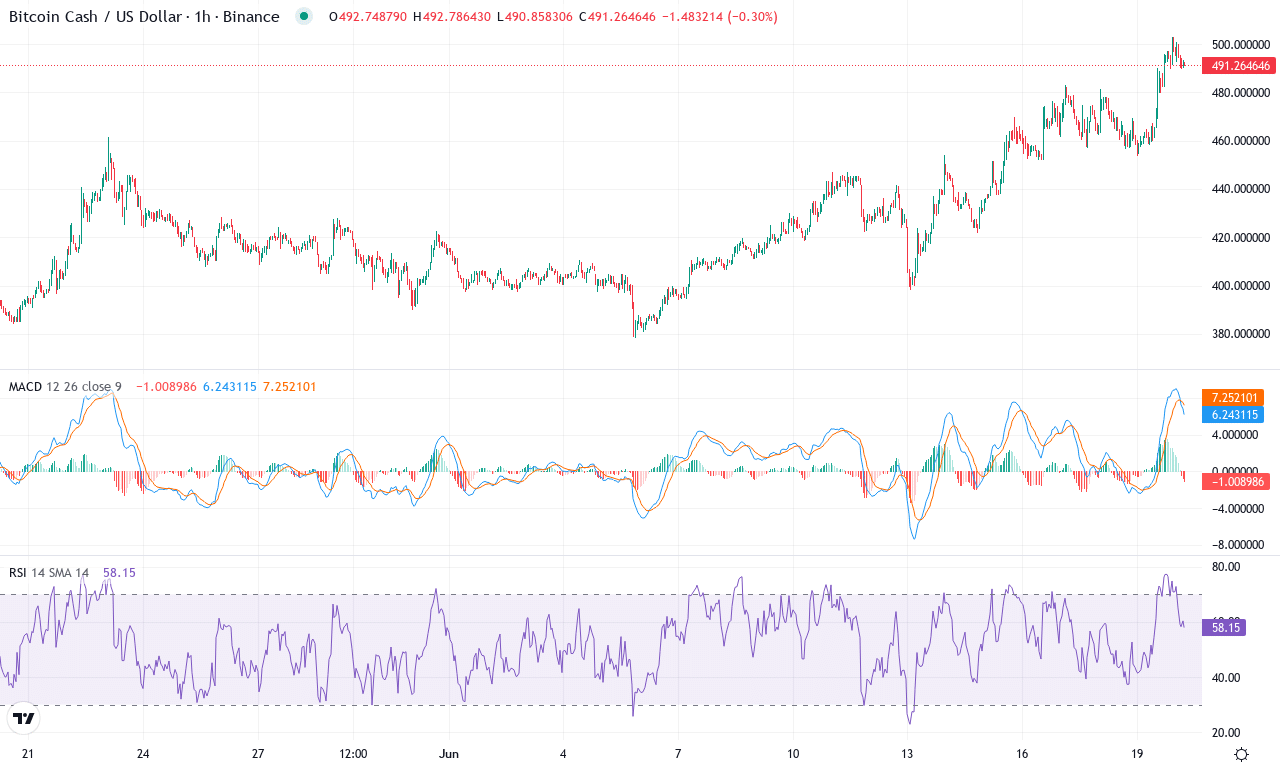
| Crypto | Close | 1W% | 1M% | RSI | ADX | MACD | CCI 20 | BITCOIN CASH(BCH) | $493.17 | 16.37% | 25.06% | 69.1 | 23.6 | 20.69 | 168.57 |
|---|
After weeks of explosive action, Bitcoin Cash is capturing traders’ attention again, surging over 16% this past week and clocking an impressive 25% monthly gain. That’s not just noise—BCH’s technical picture is starting to shift from mere recovery to outright breakout momentum. The price is pressing near recent highs, with support firming up above $490, and bulls appear emboldened following a strong three-month rally of more than 50%. With macro sentiment favoring risk assets and Bitcoin Cash riding the coattails of broader institutional flows into crypto, I wouldn’t be surprised if we’re witnessing the start of a decisive, multi-month trend shift. There’s an electric sense here—if BCH can sustain this pace, the next leg could be significant.
Diving into the technical outlook, trend indicators are lining up bullishly. The moving average convergence/divergence setup is especially compelling: the MACD line’s rapid ascent outpaces its signal, signaling swelling bullish momentum on both daily and weekly intervals. Oscillators confirm this strength, with momentum and awesome oscillator readings surging, and the RSI pushing well above its neutral zone—but not yet screaming overbought. Importantly, BCH is trading comfortably above all major moving averages, including the 10 and 20 EMA, which now arc higher and act as immediate dynamic support. The price is currently boxed in near a key resistance level close to $503; a convincing close above that zone could open the door to the next resistance around $632, based on pivot projections and recent highs. But, as any trader knows, chasing green candles can be risky; a failed breakout may see a swift pullback toward the supportive $440–$415 region. All signs point to a breakout, but at these levels, keeping risk discipline tight is crucial—if BCH does explode above resistance, I’ll be the first to cheer, but I’m not letting my guard down just yet.
Uniswap (UNI) Price Analysis
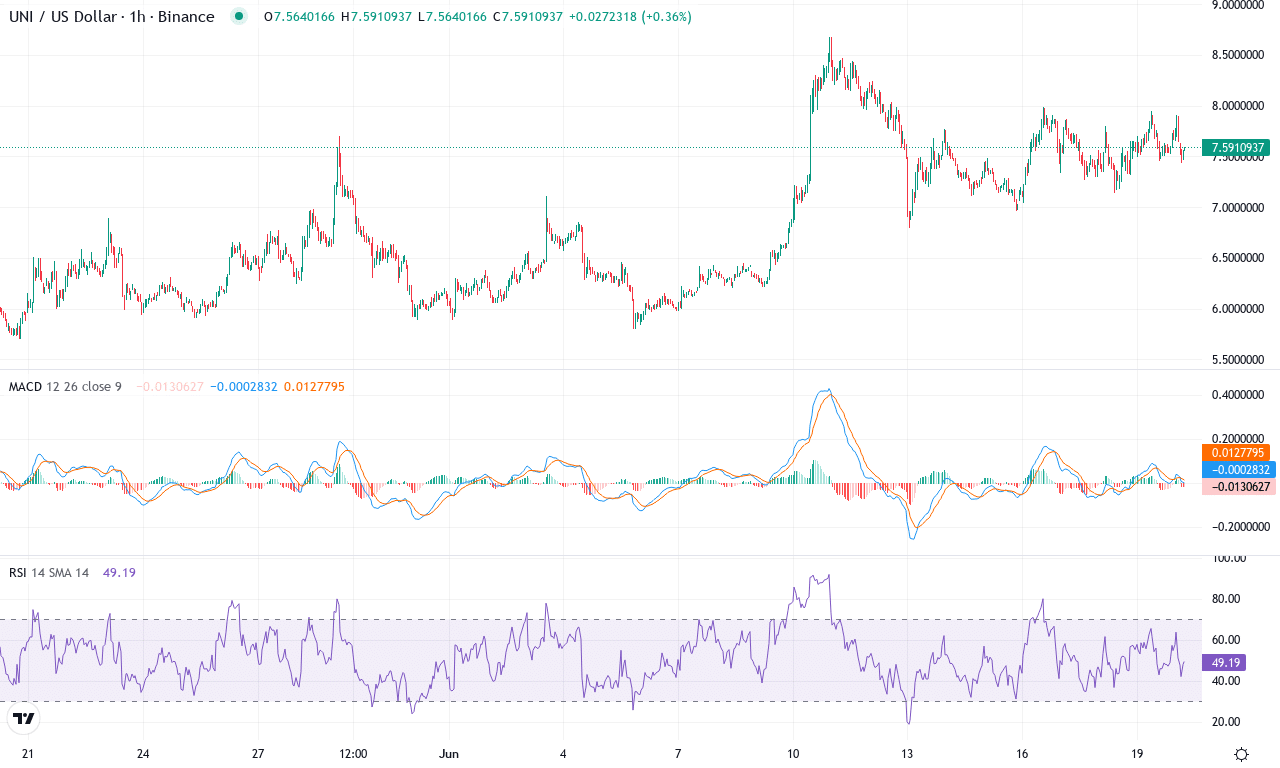
| Crypto | Close | 1W% | 1M% | RSI | ADX | MACD | CCI 20 | UNISWAP(UNI) | $7.56 | 1.12% | 25.50% | 56.9 | 34.3 | 0.35 | 61.21 |
|---|
After weeks of lackluster action, Uniswap is erupting back to life—posting an impressive 25% monthly gain and vaulting from recent lows near $5.80 to just under $8.70. This latest surge comes after a brutal six-month stretch where UNI shed over 43%, making the current move feel doubly dramatic for anyone who’s weathered the storm. While short-term traders may be celebrating the momentum shift, year-over-year performance still has a lot of catching up to do—a reality check for those banking on a swift recovery. With bullish momentum swelling and price suddenly dominating atop monthly pivots, Uniswap’s technical outlook suggests the range-bound doldrums might finally be in the rearview mirror.
Diving into the technical landscape, trend indicators like the ADX are solidly elevated, confirming robust directional strength and a clear advantage for buyers as the positive DI outpaces its negative counterpart. The weekly MACD is pivoting higher, signaling growing bullish conviction; meanwhile, RSI hovers in high gear, reflecting powerful—but not quite overheated—momentum. UNI now trades decisively above all major moving averages, including the 10, 20, and 50-period EMAs, further reinforcing the breakout momentum. Critical resistance looms at the recent high near $8.70, and if bulls can muster a close above this psychological zone, the next upside target stretches towards the $12 mark. However, if profit-taking accelerates or price fails to hold above $7.20 support, don’t be surprised by a swift correction back toward the $6.20 region. Personally, if UNI cracks $9 with this kind of volume, I’ll have both eyes glued to the chart—the crowd’s mood could shift fast as stop orders and momentum traders pile in. The stage is set for fireworks; risk management is essential as volatility storms back into play.
Will EOS Hold, or Will Bears Prevail?
EOS remains vulnerable to a breakdown unless buyers step in at current levels to stabilize its price. Bitcoin Cash tests its bullish resolve, eyeing breakthroughs with continued buying interest necessary for further gains. Uniswap is on the cusp of a potential breakout, yet requires sustained volume to validate its rally. As volatility looms, traders are poised to act decisively with each shifting signal.