ETH, BCH, and COMP Rally Intensifies as Overheated Signals Hint at Unseen Reversal
Ethereum (ETH), Bitcoin Cash (BCH), and Compound (COMP) have all garnered attention with their impressive rally over the past month, each surging into critical resistance territories. As buying pressure propels prices upward, key technical indicators reveal areas of overheating, suggesting potential reversals looming on the horizon. Could this bullish phase stretch further, or are traders due for a reality check? Let’s take a closer look at the signals behind the move.
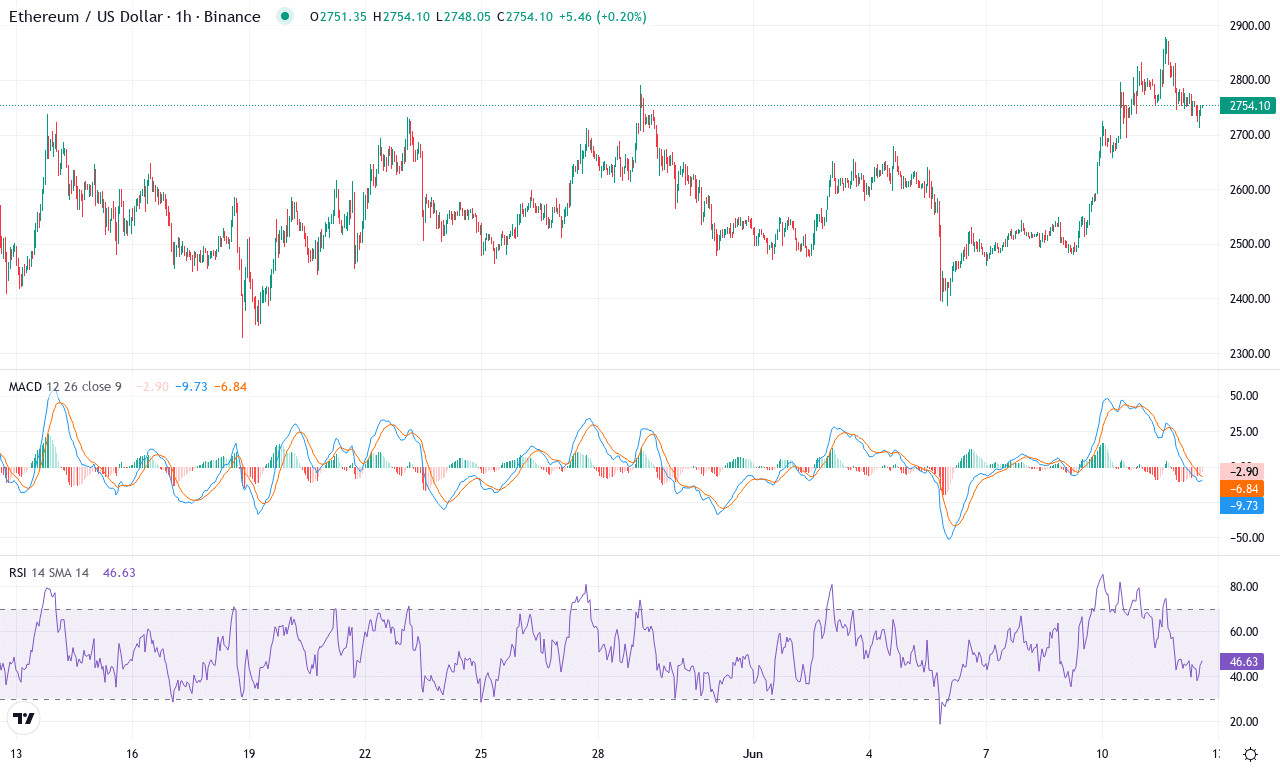
Ethereum (ETH) Price Analysis
| Crypto | Close | 1W% | 1M% | RSI | ADX | MACD | CCI 20 |
|---|---|---|---|---|---|---|---|
| ETHEREUM(ETH) | $2746.96 | 5.36% | 10.04% | 62.2 | 25.6 | 89.01 | 131.11 |
After a choppy six months—marked by a harsh pullback and fits of volatility—Ethereum is regaining its stride. Up over 10% on the month and surging more than 5% just this week, the second-largest crypto is pushing back toward the upper range of its recent monthly highs, while still contending with major macro uncertainty. Recent price action shows ETH holding just beneath its key resistance zone at $2,880, a region that capped advances throughout the last several weeks. Still, with buyers shaking off the prior drawdown, we’re seeing some real momentum build. If Ethereum can break and sustain above this overhanging ceiling, a renewed rally toward $3,400 or even $3,900—both heavy psychological and technical resistance zones—could be unleashed. As a trader, I can feel the tension mounting; a clean breakout here could be explosive.
Digging into the technicals, trend indicators paint a picture of recovering bullish momentum—ADX shows strengthening trend structure, and positive directional movement is overtaking bearish pressure. The weekly MACD is accelerating, confirming upward force after months of languishing near the flatline. Supporting oscillators like RSI and the Ultimate Oscillator are both on the rise but not yet overbought, suggesting there’s fuel in the tank before exhaustion sets in. Ethereum’s close is steadily advancing above all its key moving averages, a classic signal that institutional interest could be returning and buyers are stacking in. Immediate support sits near $2,600, while the $2,350 level below that would become critical if sellers spark a steep correction. Here’s my scenario planning: if bulls clear the $2,880–$2,900 resistance cluster, eyes will quickly shift to $3,400 and $3,900 upside targets; fail to break out, and we could see a bout of profit-taking down to those support levels. All signs point to pivotal days ahead—ETH volatility is surging, and whichever side wins this standoff will define the next macro leg. Buckle up.
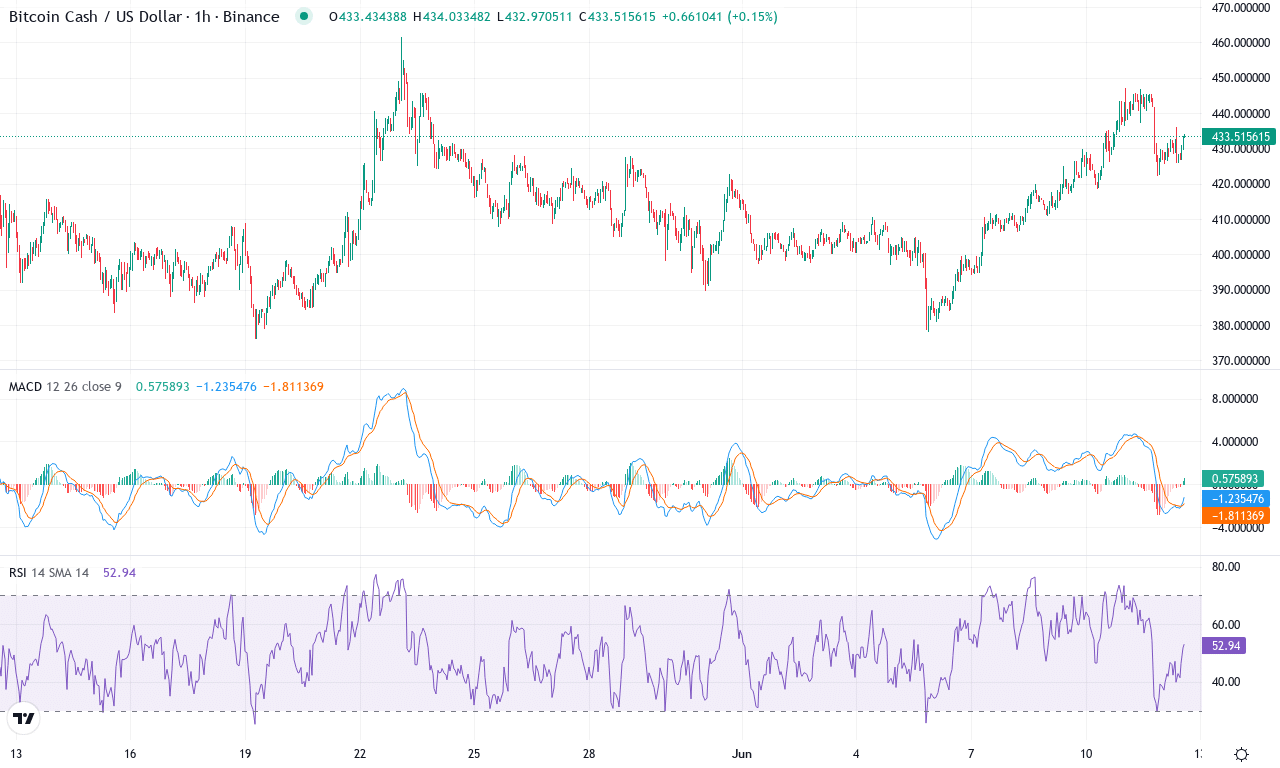
Bitcoin Cash (BCH) Price Analysis
| Crypto | Close | 1W% | 1M% | RSI | ADX | MACD | CCI 20 |
|---|---|---|---|---|---|---|---|
| BITCOIN CASH(BCH) | $432.89 | 8.15% | 5.40% | 59.6 | 22.2 | 7.75 | 120.82 |
After several weeks of tightening rangebound action, Bitcoin Cash is finally pushing higher, catching fresh bids and outperforming many of its large-cap peers with an 8% weekly surge and over 5% monthly gain. While volatility remains elevated after a turbulent quarter, the latest rebound sends BCH to the upper end of its monthly range, brushing against a resistance zone just above $460—a level that twice rejected rallies in recent sessions. Despite trailing its three-month gains, this move signals traders are once again betting on a trend shift, eager to take advantage of the bullish momentum after last quarter’s sharp 20% drawdown. From a macro lens, the setup is compelling: after a choppy year, BCH appears to be reawakening, hinting the worst of the downturn may be behind us. I’d be watching closely—sentiment can flip in a heartbeat at these decision points.
Technically, the evidence points to robust trend strength: trend indicators are firmly aligned higher, while the weekly MACD, after a brief pause, has started to accelerate upwards—often a precursor to an extended rally if coupled with favorable price action. Momentum oscillators and RSI are both climbing, but neither are stretched into overbought territory just yet, indicating there’s still runway before conditions get overheated. Price is trading comfortably above its short- and medium-term moving averages, and the hull and Ichimoku baselines lend further support, reinforcing the bullish thesis. If bulls can clear resistance at $460–$465, the next major target sits at $520, where overhead supply likely intensifies. However, failure to pierce this ceiling could spark swift profit-taking and a sharp move back to support around $410, where moving averages and previous lows converge. For now, all signs point to a constructive breakout—but as always, keep stops tight when volatility is on the rise; it only takes one shakeout to shift the entire landscape.
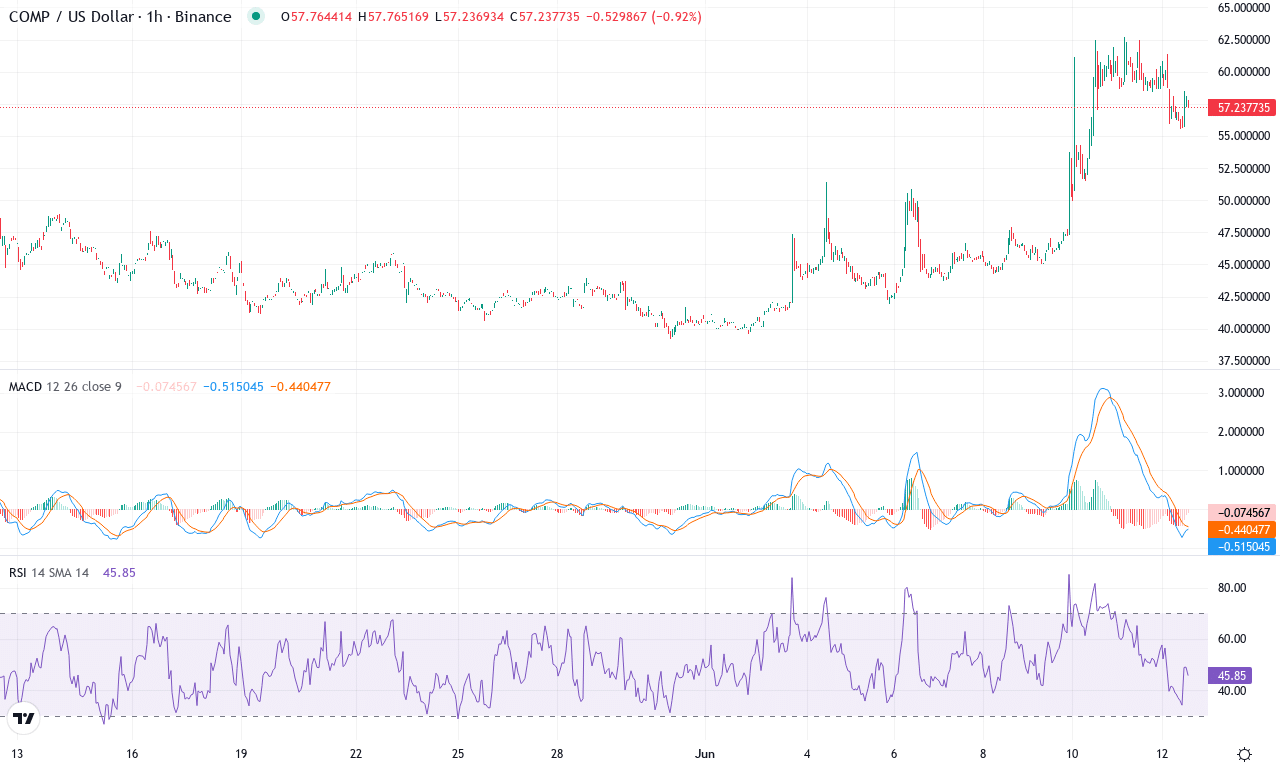
Compound (COMP) Price Analysis
| Crypto | Close | 1W% | 1M% | RSI | ADX | MACD | CCI 20 |
|---|---|---|---|---|---|---|---|
| COMPOUND(COMP) | $57.60 | 28.52% | 23.45% | 69.7 | 31.8 | 3.45 | 185.83 |
After an explosive 43% spike across the past three months, Compound (COMP) is showing definitive signs of bullish resurgence—though recent price action suggests traders should brace for heightened volatility. The token’s monthly climb, surging over 23%, marks a robust comeback from its six-month drawdown and now positions COMP near the upper echelon of its recent range at $62.71. Oscillators are flashing mixed signals: momentum has swung back to the bulls, yet the steep rally raises eyebrows over a possible near-term overheated condition. As COMP currently trades around $57.60, just beneath a crucial resistance test, the mood is tense—if bulls press through, we could witness another short squeeze and new highs. On days like this, I can’t help but watch the order book with anticipation.
Digging deeper, the technical outlook suggests trend strength is swelling—Average Directional Index readings are robust, with trend indicators firmly favoring upside while positive momentum outpaces the bears. The weekly MACD is accelerating into positive territory, and moving averages are stacked in bullish alignment, with price holding comfortably above the 10-, 20-, and 50-day EMA bands—a classic sign that institutional flows may be picking up. However, with RSI nearing the upper mid-zone, overbought concerns could prompt sharp bouts of profit-taking. For now, immediate resistance sits at $62.70; a decisive close above that zone sets the stage for a potential push toward the $68–$70 region. But if sellers regain control and drive COMP below its $51.50 support, risks of a steep correction toward the $46 area open up. As always, keep an eye on momentum flips—when bullish exuberance meets a heavy-handed reversal, things can turn sour quickly.
Reversal or Continuation?
Ethereum eyes resistance at $2,100, while Bitcoin Cash approaches $270, both showing signs of exhaustion. Compound hovers near $70, with momentum on the edge. Traders should watch for cooling patterns or renewed buying — the next trend shift hinges on these pivotal pressure points.