Ethereum And Zcash Clash At Critical Zones As Bulls Eye $2,800 And $56 Triggers
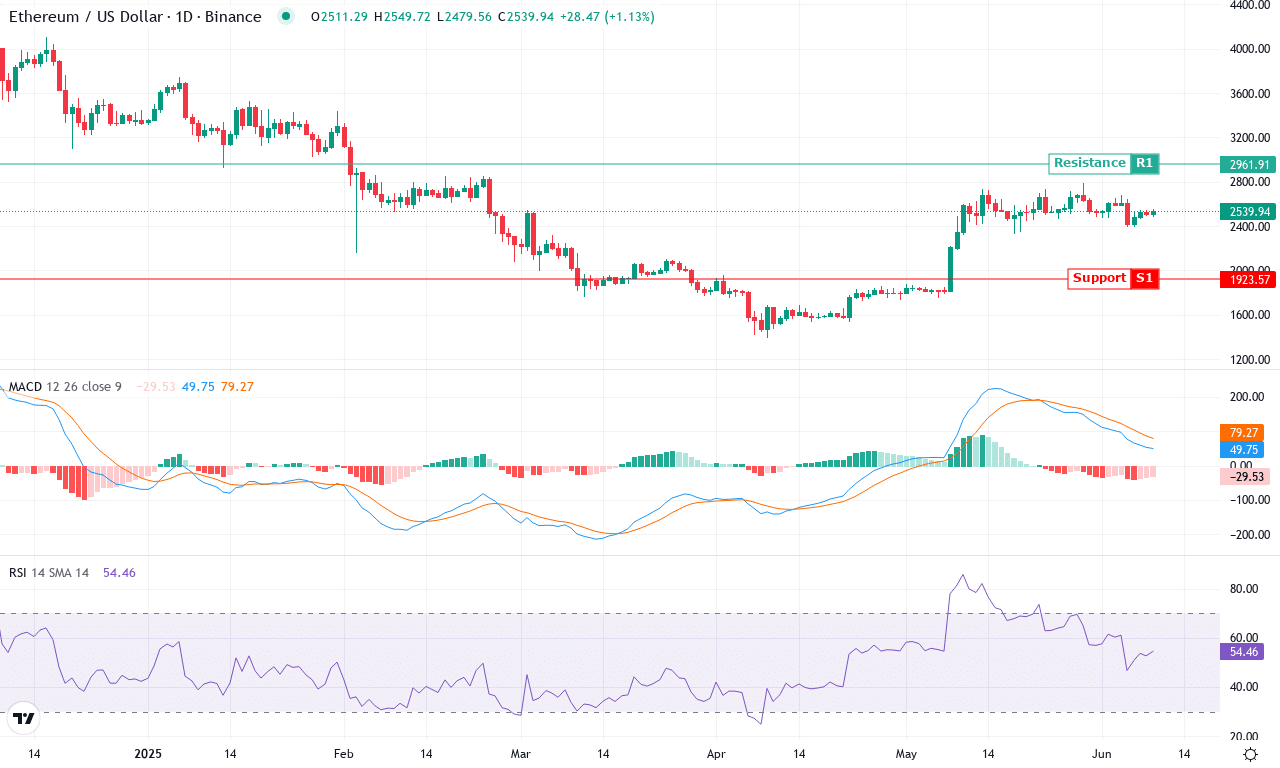
Ethereum and Zcash are both navigating critical junctures, having posted significant gains amidst recent crypto market volatility. Ethereum’s steady climb has it poised beneath the critical $2,800 mark, hinting at a possible breakout if bullish momentum prevails, yet the shadow of a retracement lingers.
Ethereum (ETH) Price Analysis
| Crypto | Close | 1W% | 1M% | RSI | ADX | MACD | CCI 20 |
|---|---|---|---|---|---|---|---|
| ETHEREUM (ETH) | $2543.81 | 0.18% | 8.48% | 54.7 | 22.2 | 49.95 | -53.62 |
After a month of unsteady but upward movement, Ethereum is showing signs it might be ready for another leg higher, following an impressive 8% monthly gain and holding firm above $2,500. The past week delivered little net change, but the broader backdrop deserves attention: over the last three months, Ethereum has rallied nearly 36%, defying the correction that gripped other assets. That said, the trend is a battleground. Despite renewed optimism, this year’s performance remains negative, a painful reminder that bulls still need to recapture long-term momentum. With price now hovering just below the strong psychological zone at $2,800, traders eye a decisive breakout—but the real drama unfolds if bears manage to drag ETH back below $2,300, a floor fiercely defended all month.
Digging deeper, the technical outlook suggests Ethereum’s momentum is on a razor’s edge. The MACD, having recovered sharply on the monthly timeframe, is showing some divergence as the signal line lags the price—hinting at potential exhaustion if bulls slack off. Trend indicators still lean positive, with a robust directional index and price trading comfortably above short and medium EMAs; a classic recipe for continued upside—at least for now. Relative strength is elevated but not yet overbought, signaling there’s room for another surge, while oscillators like the CCI and ultimate oscillator echo this cautious optimism. If bulls can force a close above $2,800, the path clears toward the next resistance near $3,000, and I’d be thrilled to see that scenario unfold. However, any bearish reversal at these heights risks a swift correction back toward $2,350, where renewed bids would likely surface. Stay nimble—when Ethereum builds pressure at such critical levels, volatility usually isn’t far behind.
Meanwhile, Zcash’s rally, initiated by a robust recovery, now faces resistance as price action flirts with the $56 level, suggesting possible cooling. Will these levels hold the key to further gains or signal a tactical retreat? Time to examine whether momentum can carry through.
Zcash (ZEC) Price Analysis
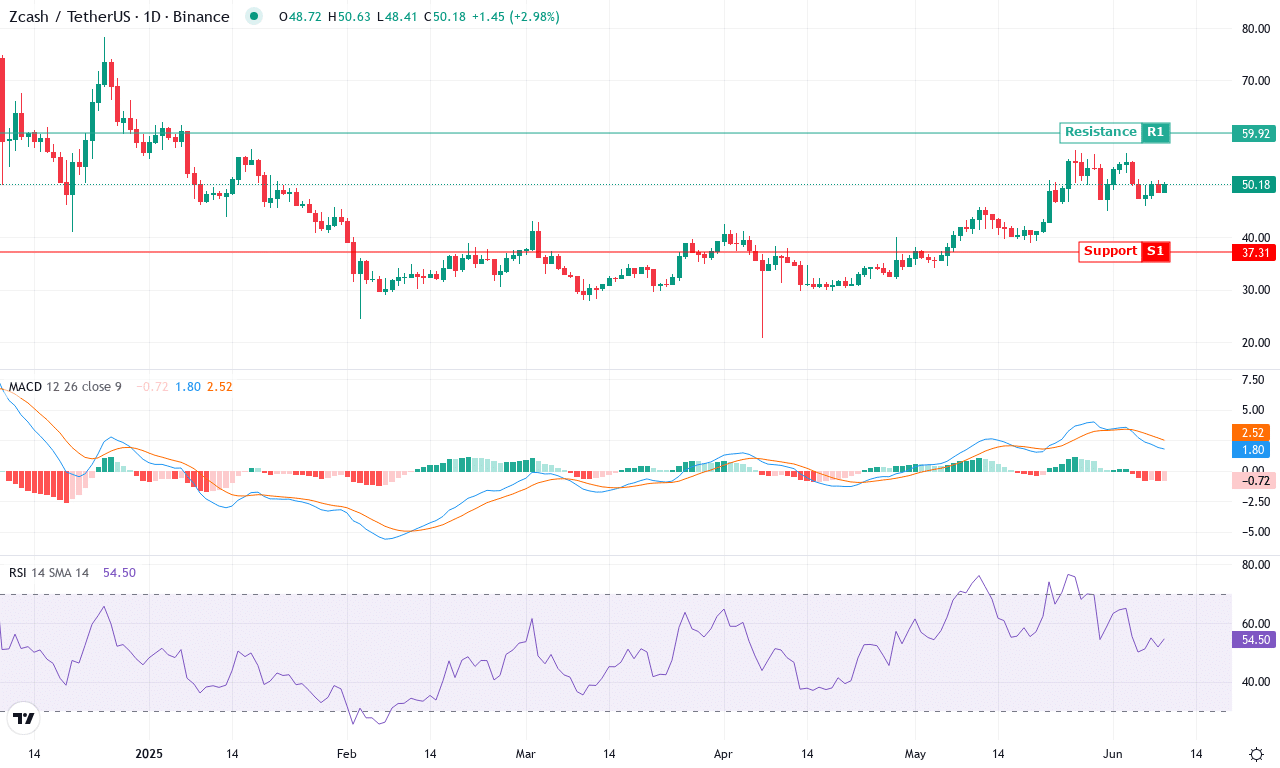
| Crypto | Close | 1W% | 1M% | RSI | ADX | MACD | CCI 20 |
|---|---|---|---|---|---|---|---|
| ZCASH (ZEC) | $50.28 | -5.36% | 20.06% | 54.7 | 27.5 | 1.81 | -16.97 |
After a booming three-month run that pushed Zcash up over 70%, recent price action signals a sharp change in tone. ZEC surged this month, vaulting off lows near $39 and approaching $57 before pulling back sharply, handing bulls a 20% monthly gain but stalling hard just beneath $51. This week’s modest retreat and the coin’s failure to break decisively above the $56–$57 resistance band hint at profit-taking and a cooling rally. While broad crypto sentiment remains buoyant, ZEC’s near-term bearish reversal—down over 5% on the week—underscores mounting caution. Still, zooming out, the longer-term technical outlook is constructive: despite a volatile ride, Zcash has outperformed the market by a wide margin over the past year.
Digging into the technicals, trend indicators show ZEC at a crossroads. The ADX reveals strong trend strength, with positive directional indicators still leading but converging uncomfortably close with the negative side—a classic signal that bullish momentum is faltering. The weekly MACD still displays positive momentum, but its signal line is flattening, increasing the risk of a crossover and a deeper correction if sellers gain the upper hand. Oscillators point to a potential loss of upward pressure: RSI remains elevated but has rolled off its highs, while the stochastic readings have dropped out of overbought territory. With Zcash trading just above the 10- and 20-period exponential moving averages and clutching the psychological $50 handle, the next moves matter. If bulls can reclaim $56, a renewed breakout toward $60 and possibly $70 looks feasible. On the flip side, a break below $48 could see long liquidations accelerate, exposing ZEC to a steeper drop toward major support at $44. Personally, I’m eyeing the middle—if buyers can defend these levels, the uptrend remains technically sound, but the risks of a swift, momentum-driven reversal are climbing fast. Strap in—this one could move sharply either way.
What Lies Ahead for Ethereum and Zcash?
Ethereum is approaching the pivotal $2,800 level, hinting at potential gains if bullish momentum can press on. Similarly, Zcash teeters near $56, with resistance in sight and the possibility of a pullback. Traders should watch for momentum shifts as these key levels could either unlock further upside or prompt a tactical retreat.