Ethereum Bulls Eye $3,750 Breakout As Solana Teeters On $150 Line—Which Trend Will Define June
Ethereum has begun to flex its muscles, rising from the shadows of a stagnant quarter towards a potential breakout above $3,750—right as Solana teeters on its own $150 line. This recent uptick has fans and analysts alike watching closely as bulls rally towards key resistance levels, with Ethereum posting impressive weekly gains. As both assets navigate these pivotal points, traders face a critical juncture: will Ethereum maintain momentum and breach new territory, or will Solana’s retreat foreshadow a broader pause in the market? Let’s break down what the signs and indicators suggest for what’s next.
Chainlink (LINK) Price Analysis
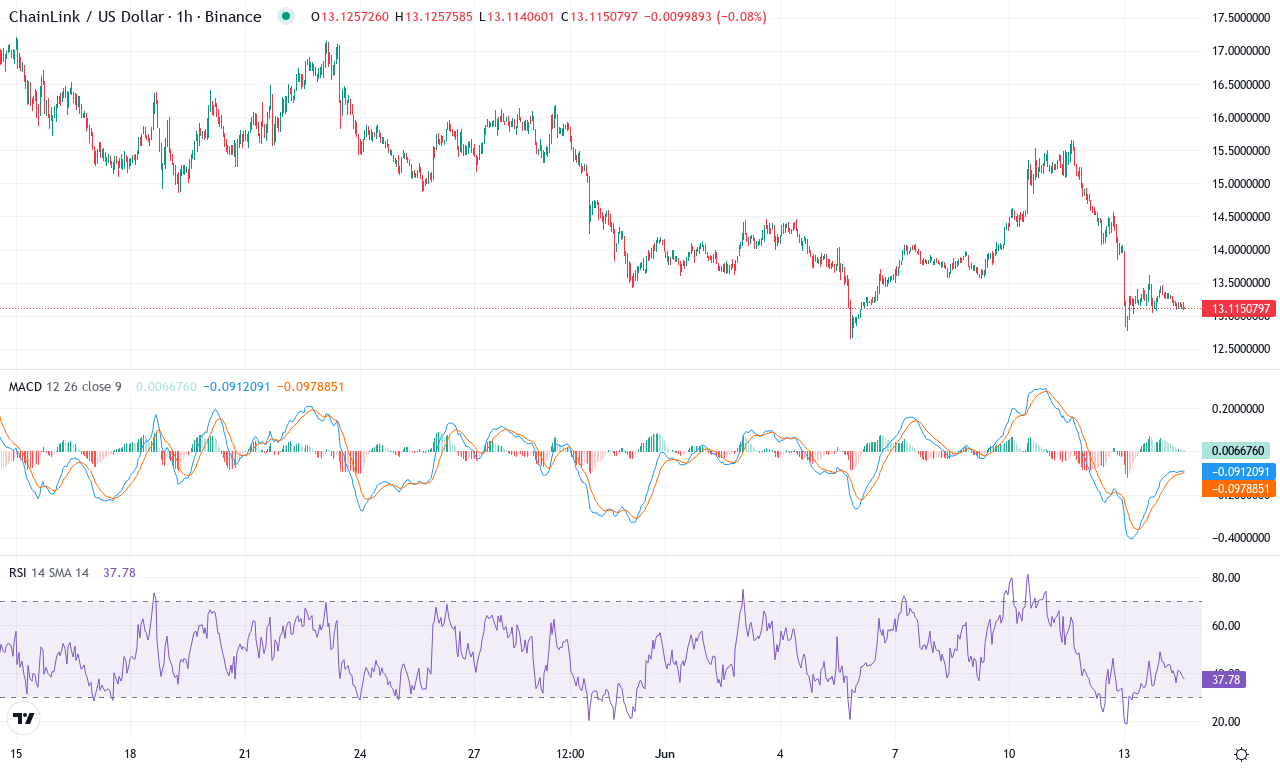
| Crypto | Close | 1W% | 1M% | RSI | ADX | MACD | CCI 20 | CHAINLINK(LINK) | $13.08 | -3.68% | -23.14% | 39.4 | 20.0 | -0.37 | -105.26 |
|---|
Avalanche (AVAX) Price Analysis
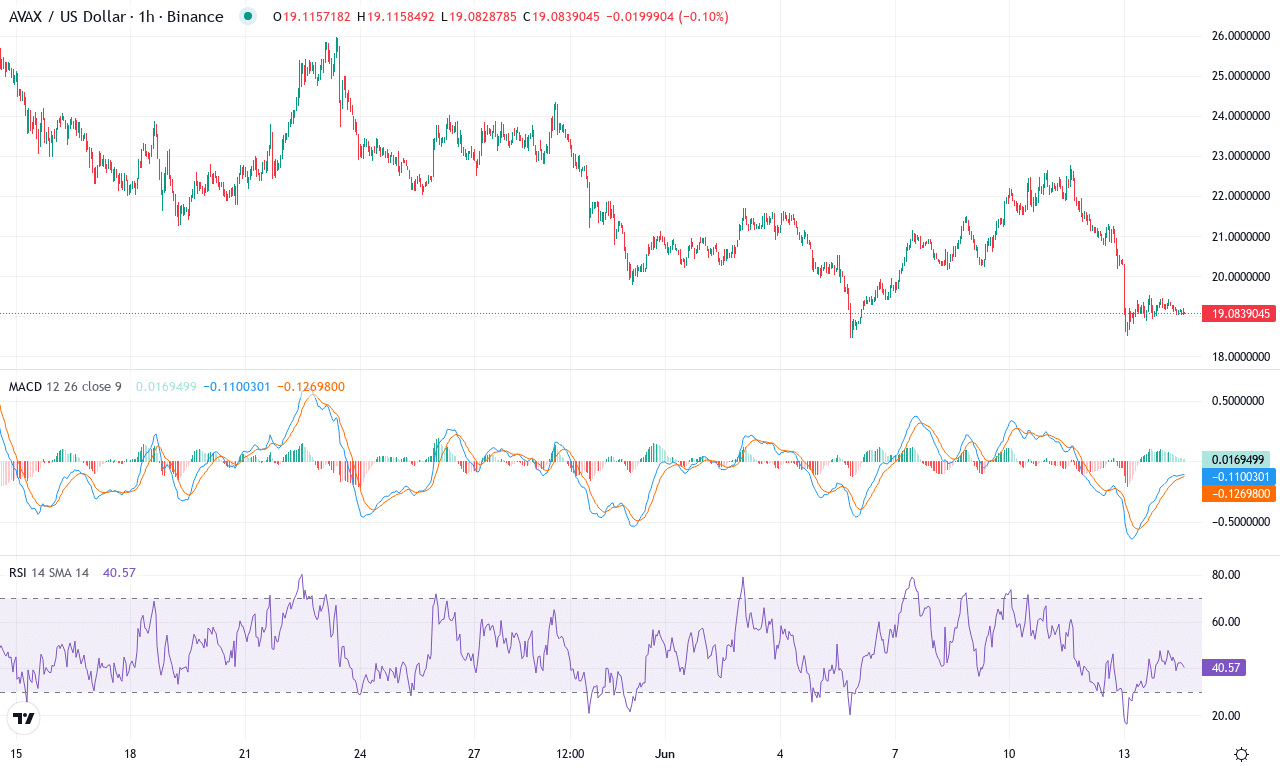
| Crypto | Close | 1W% | 1M% | RSI | ADX | MACD | CCI 20 | AVALANCHE(AVAX) | $19.04 | -3.23% | -23.74% | 39.1 | 16.1 | -0.59 | -125.13 |
|---|
Pepe (PEPE) Price Analysis
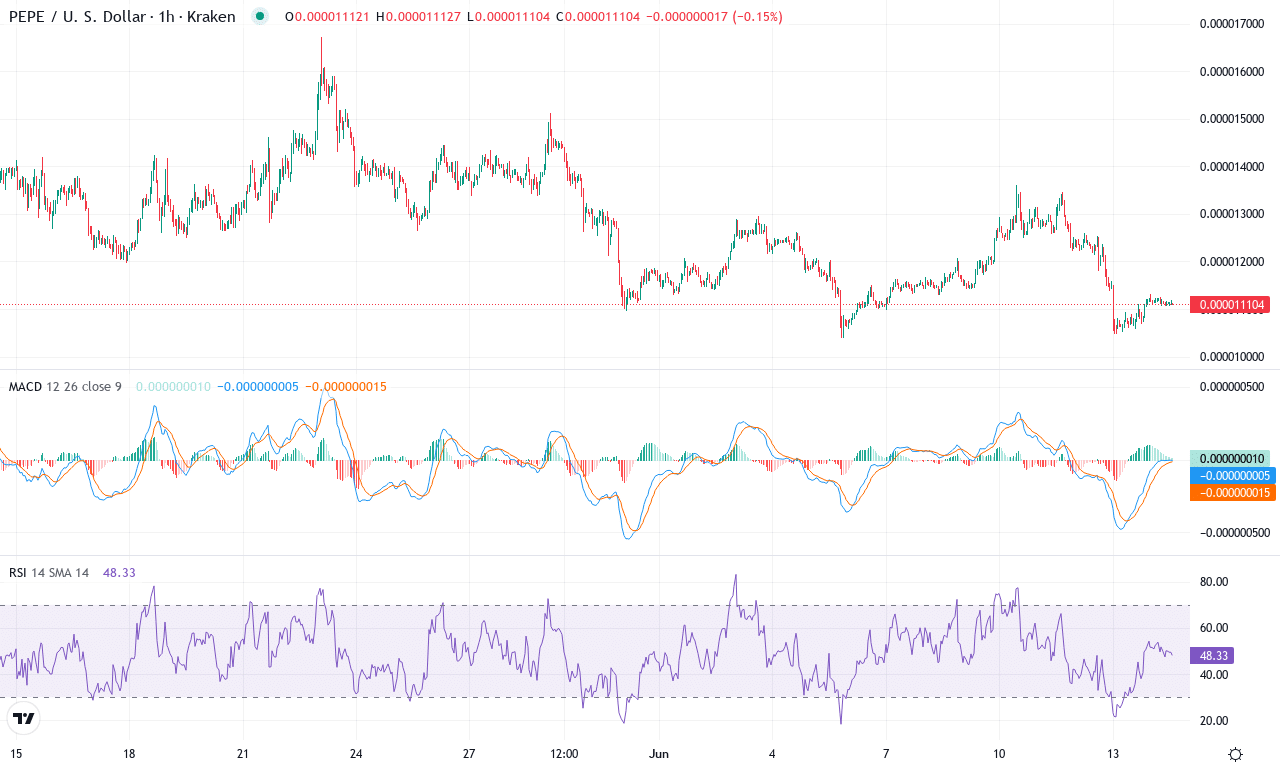
| Crypto | Close | 1W% | 1M% | RSI | ADX | MACD | CCI 20 | PEPE(PEPE) | $0.00 | 0.09% | -20.39% | 43.3 | 22.0 | 0.00 | -89.19 |
|---|
After a sharp rally earlier this quarter, Solana is now navigating turbulent waters, having pulled back from its monthly high near $176 to settle just above significant support. The altcoin shed over 10% this week, dragging its monthly performance into negative territory—a reality check for bulls after months of outsized gains. The macro trend remains up over six and twelve months, but momentum is cooling; the swift drop from recent highs feels like a profit-taking surge and a sobering reminder that volatility is still very much the rule in crypto markets. The technical outlook suggests a fragile balance: Solana has not yet broken its uptrend, but with sellers reasserting control, the next sessions could define the market’s tone for June. I’ve got my eye on the $150 level—if Solana loses its footing there, risks of a steeper correction grow rapidly.
Diving into the technicals, trend indicators show Solana’s bullish momentum is fading—directional signals and oscillators have reversed off overbought zones, while the weekly MACD is rolling over and losing altitude. Short-term EMAs are being tested, and Solana’s price is flirting with the convergence zone of its 20- and 30-day averages. Oscillators are flashing mixed signals: the RSI has slipped below the midline, pointing to sapped buying enthusiasm, and momentum indicators warn that sellers are regaining control. If bulls can defend $150, a rebound could retest resistance around $168, where failed breakouts have repeatedly triggered long liquidations. However, a breakdown below $150 would likely open the floodgates toward the $135–$128 support zone—a move that would shake out weak hands and potentially set up a stronger base for the next advance. For now, I’m watching for direction: whipsaw volatility is high, and complacency is dangerous. Stay nimble.
Navigating The Dual Trends
Ethereum edges closer to its breakout target, but sustained momentum is key for surpassing $3,750 and setting new highs. Meanwhile, Solana hovers near the $150 line, where any drop could indicate broader market hesitation. The upcoming sessions may either validate Ethereum’s bullish potential or highlight Solana’s cautionary signals, setting the tone for June’s market dynamics.