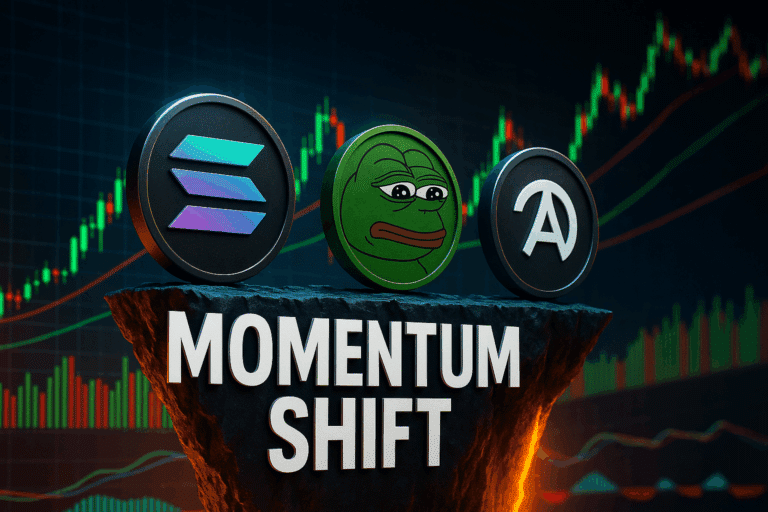
Ethereum, Cardano, and Sui Test Fragile Support as Bulls Face Momentum Squeeze
Ethereum, Cardano, and Sui find themselves in a precarious dance as they teeter on critical support levels amidst recent market fluctuations. After Ethereum’s significant run-up to touch $2,500, it’s now testing the patience of investors with a subtle pullback, introducing a tactical dilemma between sustained bullish momentum and potential exhaustion. Meanwhile, Cardano and Sui are confronting their own slipping holds, each posing different strategic considerations. Can these coins rally amid growing bearish pressure, or are they poised for deeper corrections? Let’s break down the technical setup across the board.
Ethereum (ETH) Price Analysis
| Crypto | Close | 1W% | 1M% | RSI | ADX | MACD | CCI 20 | ETHEREUM(ETH) | $2515.61 | -4.78% | -0.32% | 48.4 | 15.5 | 15.30 | -54.50 |
|---|
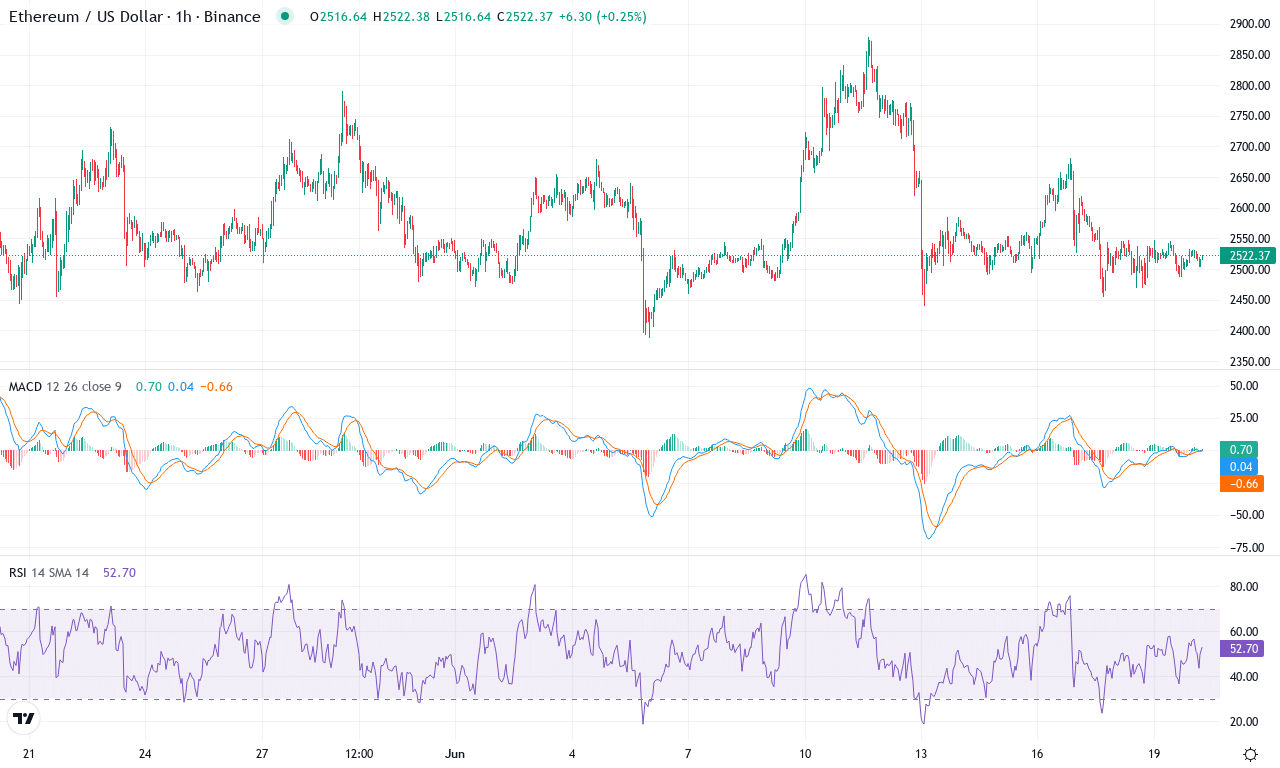
After an intense three-month ascent, Ethereum is now pausing just above $2,500, teasing traders with uncertainty after shedding nearly 5% this week. While its monthly performance is essentially flat—underscoring investor indecision—the broader story is one of volatility returning with a vengeance. That 28% three-month surge seems a distant memory as sellers press Ethereum toward the lower end of its recent $2,400–$2,880 range. This pullback is more than just immediate profit-taking; the technical outlook suggests a battle between waning bullish momentum and determined bears. For those of us watching closely, this feels like the eye of the storm—if ETH cracks major support, brace for a steeper correction.
Diving into the charts, trend indicators show Ethereum is losing altitude: the ADX confirms the uptrend is weakening, while both MACD and key oscillators hint at bearish crossovers after weeks of positive action. The MACD line rolling over below its signal, paired with stalling momentum, paints a picture of buyers running out of steam. RSI is wavering in neutral territory, neither overbought nor truly sold-off, but that can quickly shift if price slices through the $2,400 support. On the upside, the tightly packed moving averages between $2,450 and $2,550 are acting as a battleground for bulls and bears, while the psychological round number at $2,800 looms as the next major resistance to watch. Scenario planning is critical here: if sellers drive ETH decisively below $2,400, risks of an extended fall toward $2,000 mount fast; but a convincing bounce could propel the token back to challenge $2,880—and perhaps trigger a breakout momentum run. Personally, I’m keeping stops tight: in this market, you’re not in the red until you sell, but complacency can be costly.
Cardano (ADA) Price Analysis
| Crypto | Close | 1W% | 1M% | RSI | ADX | MACD | CCI 20 | CARDANO(ADA) | $0.59 | -10.30% | -20.75% | 31.8 | 19.7 | -0.03 | -136.89 |
|---|
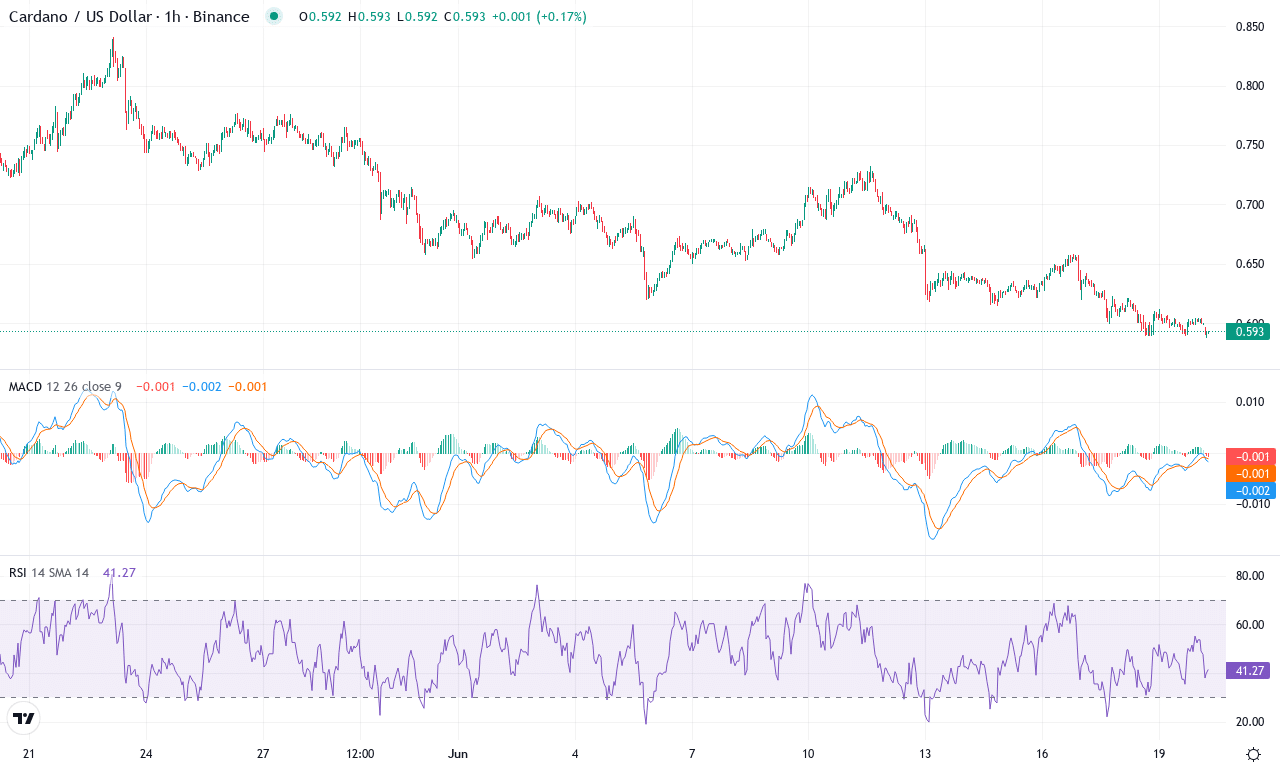
After a turbulent month marked by a sharp -20% monthly decline, Cardano (ADA) is now grappling with the aftermath of its worst sell-off since early this year. The coin’s price retreated from a high of $0.84 down to a key technical and psychological support zone near $0.59, erasing prior quarterly gains. With a -10% drop just in the last week, ADA sentiment has soured, and shorter-term traders are feeling the sting. Still, with yearly performance clocking in at over 50% in the green, there’s a sense that the broader macro trajectory remains positive despite recent carnage. From my seat, this feels like a make-or-break moment: if Cardano stabilizes here, we could see an explosive reversal. But if the bottom gives way, risks extend toward a much steeper correction.
Looking under the hood, the technical outlook suggests bears are still steering the ship for now. Trend indicators are losing their bullish edge—the directional index signals strong downside pressure, and the weekly MACD is curling lower, with negative momentum swelling on key oscillators. With the price stuck under its key 20- and 30-period exponential moving averages, any attempted bounces will face headwinds from overhead resistance near $0.65 and again at $0.73. RSI readings have dropped sharply but aren’t yet flashing extreme oversold, while the Commodity Channel Index remains deeply negative—bounces may be limp unless sentiment flips decisively. If sellers keep up the pressure and Cardano breaks under the $0.58 support, I’d brace for a potential slide toward the $0.51 region. Yet a powerful close above $0.65 could flip the script entirely, setting up a run towards $0.73 and invalidating the current bearish thesis. Personally, I’m watching these levels with heightened attention—ADA’s next move could define its 2024 narrative.
Sui (SUI) Price Analysis
| Crypto | Close | 1W% | 1M% | RSI | ADX | MACD | CCI 20 | SUI(SUI) | $2.79 | -12.95% | -27.60% | 34.7 | 30.7 | -0.17 | -122.53 |
|---|
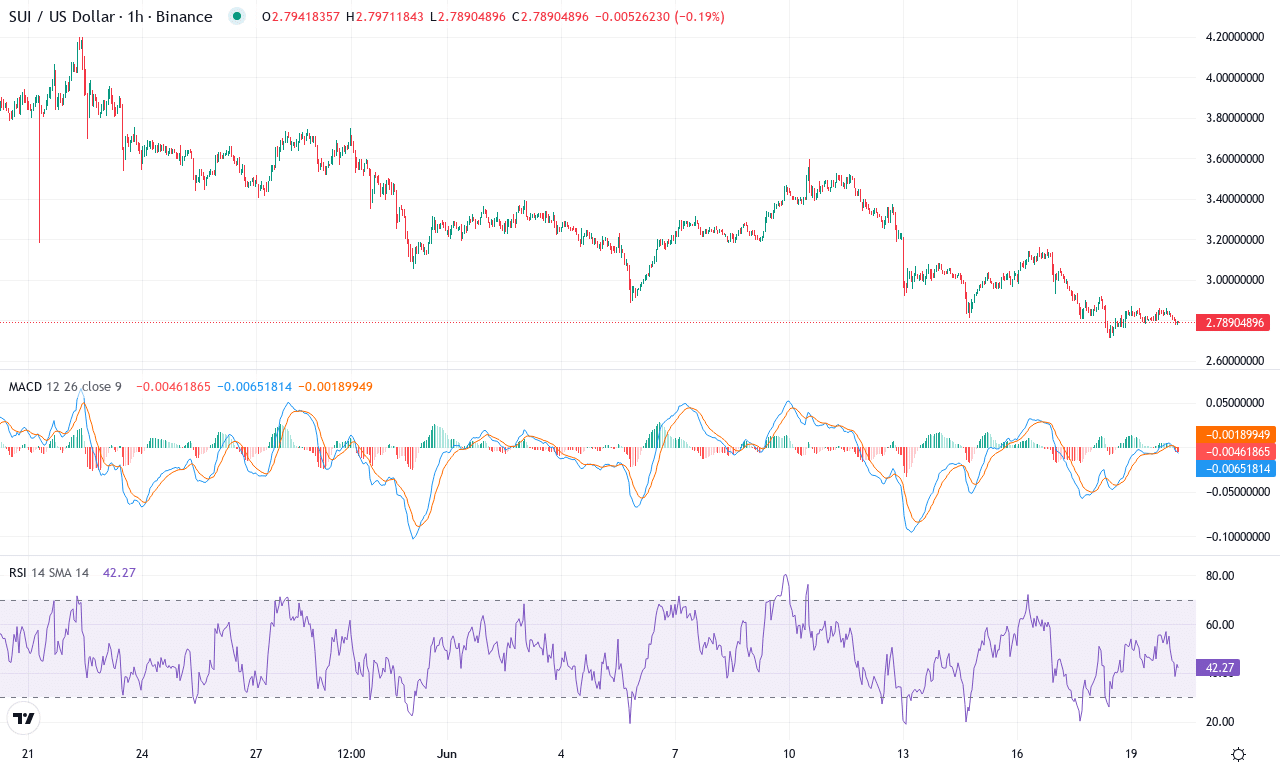
After erupting to fresh monthly highs above $4.19, Sui has suffered a sharp reversal, plunging nearly 28% over the past month and nearly 13% just this week. The trajectory paints a classic parabola: a roaring multi-month advance—up over 220% year-on-year—now running into heavy turbulence as profit-taking and macro uncertainty rattle altcoins. While Sui’s longer-term narrative remains compelling, with impressive six-month and yearly gains, the short-term technical outlook suggests bullish momentum is fading fast. If heavy selling continues, we could witness a steeper correction, and as a trader, I’m monitoring with cautious optimism—markets have a way of snapping back when least expected, but right now nerves are clearly frayed.
Diving into the technicals, Sui faces mounting headwinds. Trend indicators show the directional bias has weakened: the ADX sits above 30, signaling a previously strong trend, but negative directional readings now outpace the positive, reinforcing that selling pressure dominates. The MACD has slipped into bearish territory, with the line crossing below its signal and both momentum oscillators and the Awesome Oscillator flashing negative. Meanwhile, RSI is sliding into neutral territory, well below overbought levels, and Stochastic readings are firmly oversold—a sign the floor could be near, but buyers remain on the sidelines. Sui is currently battling for support just above $2.70, which aligns with key exponential moving averages and the monthly S1 pivot. Should this level give way, all eyes shift to the $2.30 zone—a psychological and historical support area. On the flip side, any convincing bounce above $3.00 could spark aggressive short covering, targeting $3.50 and potentially reigniting bullish momentum. For now, volatility rules, and discipline is paramount—don’t let short-term drama shake you from your plan.
Will Support Levels Hold?
Ethereum teeters on its support after reaching $2,500, with a continued struggle casting doubt on a robust rally. Cardano hovers near its critical support, while Sui similarly battles bearish undertones. All eyes are on upcoming price actions to determine whether support will hold or cracks will emerge, shaping the next phase for bulls and bears alike.