HYPE, Aave, and Maker Bulls Dominate as Parabolic Rallies Tease Breakout or Brutal Reversal
Aave, Maker, and HYPE have all captured the spotlight with staggering multi-month gains, but could their surges be running out of steam? This week saw Aave rocketing 16%, while HYPE continues its relentless run upwards, yet analysts are eyeing critical resistance levels that could make or break these bullish trends. As prices flirt with these psychological zones, traders face a pivotal moment—is this the dawn of a new breakout or the precursor to an anticipated pullback? Let’s break down what the indicators reveal and assess the strength behind these moves.
Hyperliquid (HYPE) Price Analysis
| Crypto | Close | 1W% | 1M% | RSI | ADX | MACD | CCI 20 | HYPERLIQUID(HYPE) | $40.16 | 18.15% | 55.78% | 65.8 | 42.7 | 3.19 | 85.15 |
|---|
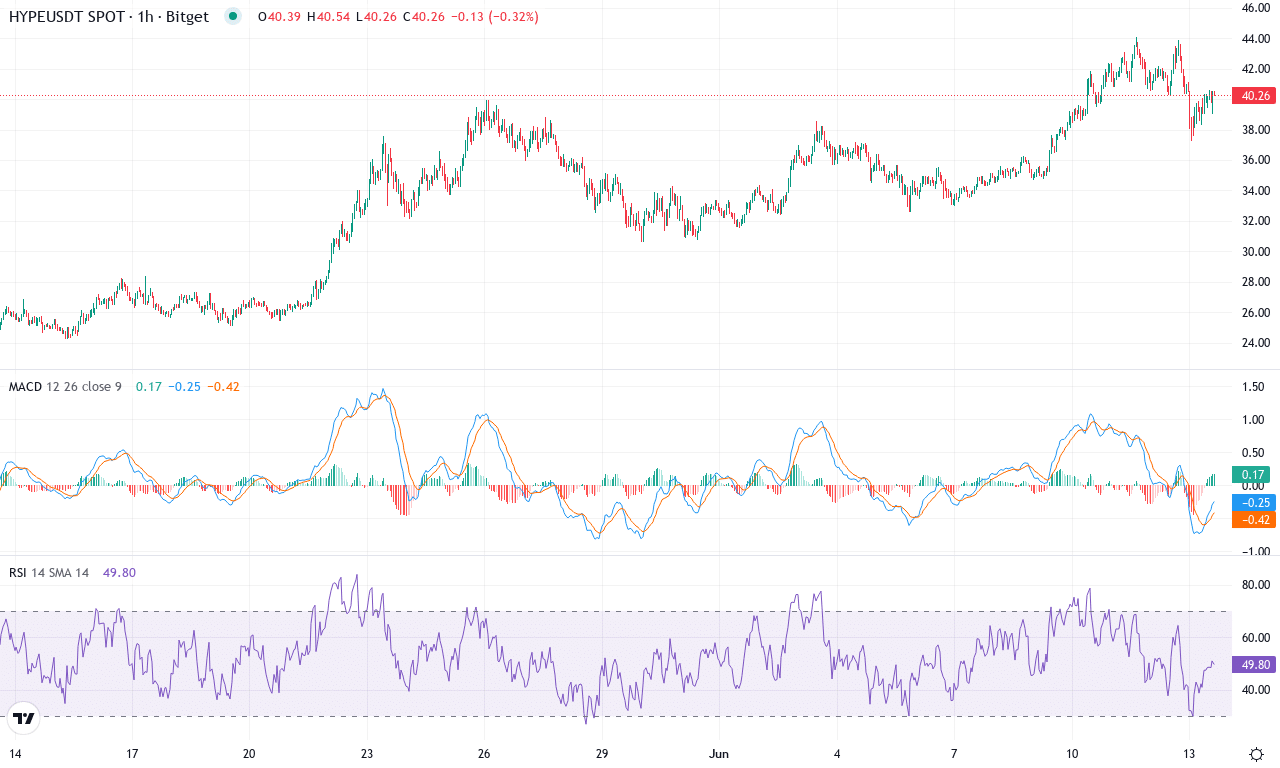
After a stellar multi-month rally, Hyperliquid (HYPE) is flexing its dominance with another breakout—up over 18% this week and notching a jaw-dropping 55% gain for the month. The coin has surged far above its recent support at $24.30, smashing through resistance zones with remarkable ease and trading at $40.16 near monthly highs. This relentless momentum has HYPE catching the attention of traders who know parabolic moves rarely go unnoticed, especially when yearly gains eclipse 1,500%. The technical outlook remains firmly bullish for now, but I’ll admit—when price runs this hot, everyone waits for either a euphoric blow-off top or that inevitable correction. Still, with institutional inflows pushing participation and volatility surging, it feels like trend followers are having the time of their lives.
Beneath the surface, the trend remains robust: key moving averages, from the fastest 10-day through the 200-day, all slope upward and sit well below price—classic confirmation of bullish momentum. The weekly MACD shows persistent acceleration, while oscillators including RSI are pushing into overbought territory but not yet screaming for a steep correction. The ADX and directional readings reveal trend strength is swelling, with bulls firmly in control; the gap between positive and negative DI lines signals sellers are still getting squeezed out. Oscillators suggest overextension, so I’m on alert for profit-taking, but until bears reclaim traction, the next major resistance looms near $44. Short-term, if HYPE slices through $44, blue sky territory opens and momentum traders will likely chase. However, failure to hold current levels could trigger a pullback toward the $34-$36 support zone—a move that, frankly, would still be healthy given the vertical ascent. Trade carefully as volatility rules, but for now, the wind is at the bulls’ back.
Aave (AAVE) Price Analysis
| Crypto | Close | 1W% | 1M% | RSI | ADX | MACD | CCI 20 | AAVE(AAVE) | $281.52 | 16.43% | 18.95% | 58.5 | 29.7 | 15.91 | 62.82 |
|---|
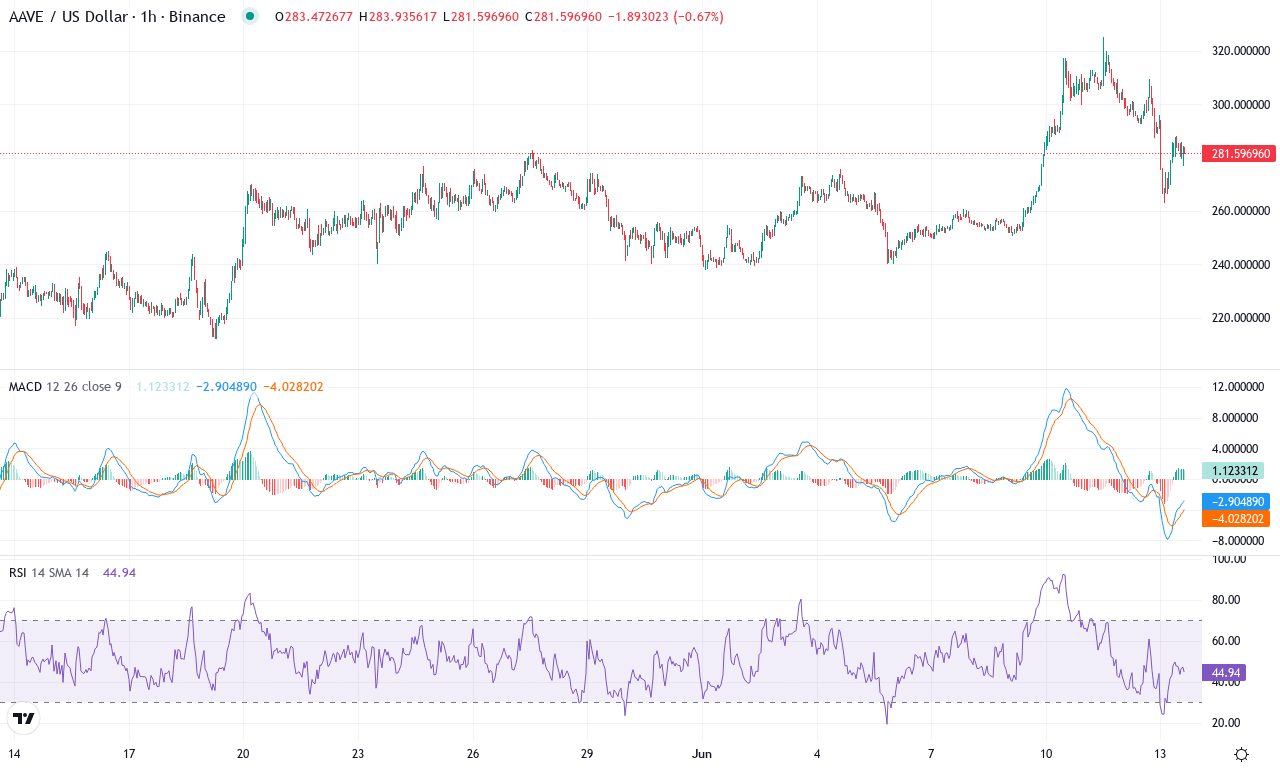
After a month marked by double-digit gains and a stunning 16% pop this week, Aave is bursting back into the spotlight. The protocol’s swift rally off monthly lows near $212 to close above $281 has ignited bullish chatter, especially among traders eyeing DeFi rebounds. Short-term performance is impressive, with the asset surging nearly 62% across the last three months; however, the six-month backdrop is less rosy, hinting that bears haven’t fully retreated. With Aave vaulting back above its closely-watched moving averages and brushing against stubborn resistance zones near $298, the market is building tension—one decisive move could spark a flurry of long liquidations or unleash a new leg up. I’ll admit: the setup here is making my pulse race.
Diving into the technicals, trend indicators are crackling with renewed energy. The weekly MACD shows fresh acceleration, keeping bullish momentum firmly on the table, while the ADX level points to genuine trend strength—the sort that rarely fizzles overnight. Oscillators cluster near overbought terrain, and an RSI lingering above 60 raises caution, but so far there’s been no dramatic reversal signal. Aave is straddling all the key exponential moving averages, reinforcing underlying support around $267 and $256. The immediate upside test is clear: if bulls punch through the resistance near $298, the door swings open for an ambitious target at $350, where both psychological and technical hurdles converge. But if profit-taking surges and sellers regain control, a pullback toward $239 or even $223 could materialize swiftly. For now, all signs point higher—but I’ll be keeping stops tight; as every trader knows: volatility can flip the script in a heartbeat.
Maker (MKR) Price Analysis
| Crypto | Close | 1W% | 1M% | RSI | ADX | MACD | CCI 20 | MAKER(MKR) | $1884.00 | 8.84% | -0.37% | 54.9 | 26.4 | 83.05 | 62.00 |
|---|
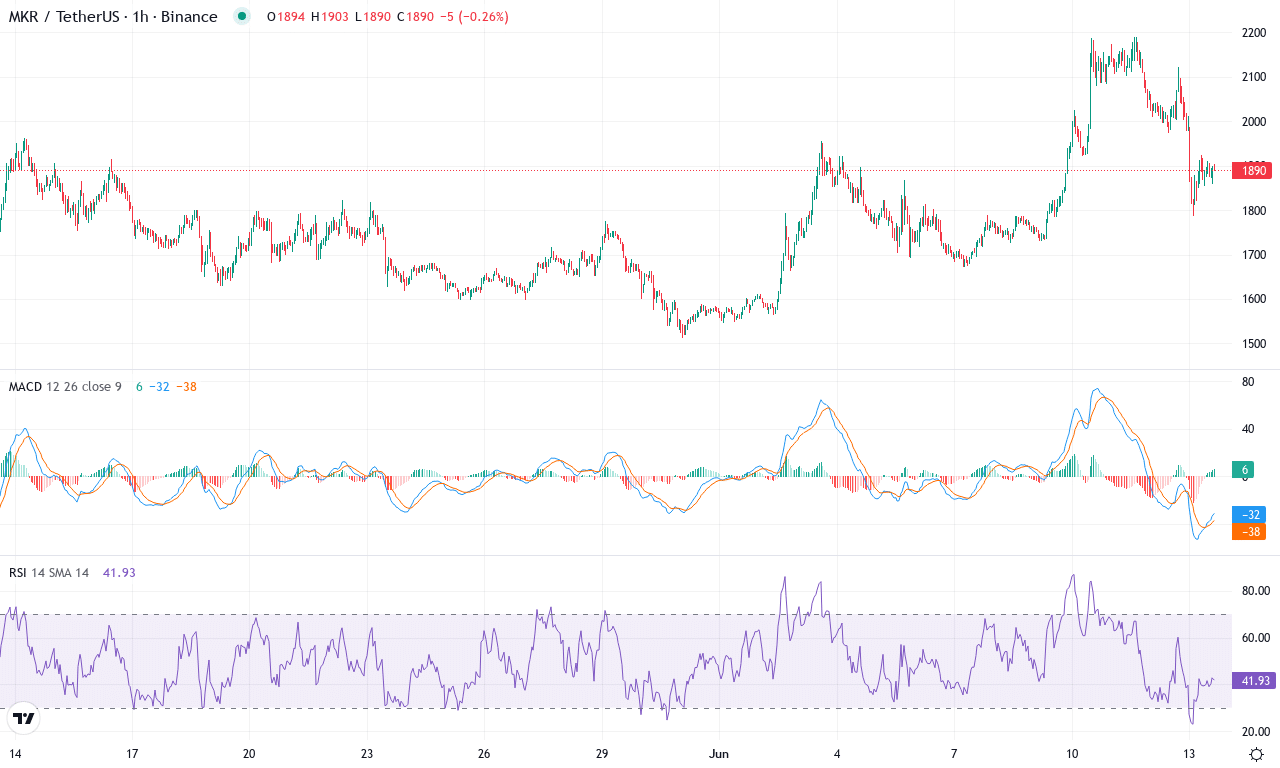
After a volatile spring marked by a dramatic run-up and subsequent retracement, Maker (MKR) is clinging to support just above $1,880. The past week has seen an encouraging bounce, with MKR posting a strong 8.8% performance after a period of lackluster monthly action—slipping less than half a percent. Despite enduring over a 60% rally in the last quarter, Maker’s overall trajectory remains choppy, as the token has struggled to reclaim ground lost in the past six months. It’s certainly caught my attention: there’s undeniable tension as bulls attempt to defend the current zone against mounting headwinds, with key psychological thresholds at $2,000 and broader resistance near $2,190 acting as gates for fresh upside momentum. While profit-taking continues to pressure prices, this elevated volatility could set the stage for a powerful breakout—whichever side wins control first.
Diving into the technicals, trend indicators are hinting at a decisive inflection. The moving average convergence/divergence (MACD) on the weekly chart is showing renewed acceleration, and the gap between bullish and bearish signals has widened further—strong evidence that bulls are regaining composure after a shaky month. Most momentum oscillators are ticking up, with RSI hovering in bullish territory, though not overheated. Notably, MKR is holding just above all its key exponential moving averages (10, 20, and 30-period), a stance that typically buffers bull runs and limits risks of a steep correction. Immediate resistance looms at $2,190—the recent monthly high. If buyers can clear this hurdle, a run toward $2,700 isn’t out of reach; conversely, a failure to hold current support around $1,800 could trigger fast long liquidations and open the door to a deeper slide toward $1,650. All signs currently point to heightened volatility, and for traders like me, that’s where opportunity lives. Stay nimble and don’t let the bears catch you napping.
Bulls on Edge: Breakout or Pullback?
Aave surged 16%, testing crucial thresholds, while HYPE presses on with little pause, facing potential breakout or imminent resistance. Maker’s rally approaches a similar tipping point that may define short-term direction. Traders must evaluate volume and momentum carefully, as these assets stand on a knife-edge between continuation and correction.