
HYPE, TAO, and OKB Teeter on the Brink as Key Supports Face Make-or-Break Test
As the crypto market pivots amidst fluctuating dynamics, Hyperliquid (HYPE), Bittensor (TAO), and OKB navigate a critical phase with their recent price movements reflecting heightened volatility. HYPE’s once soaring momentum now faces a harsh 15% pullback, hinting at a brewing storm for risk-takers. Meanwhile, TAO’s sharp -33% dive underscores a bearish narrative that leaves traders at the edge of their seats, and OKB’s subtle retreat from its highs signals potential shifts in market sentiment. Are we about to witness tactical rebounds or the dawn of deeper corrections? Let’s break down the technical setup across the board.
Hyperliquid (HYPE) Price Analysis
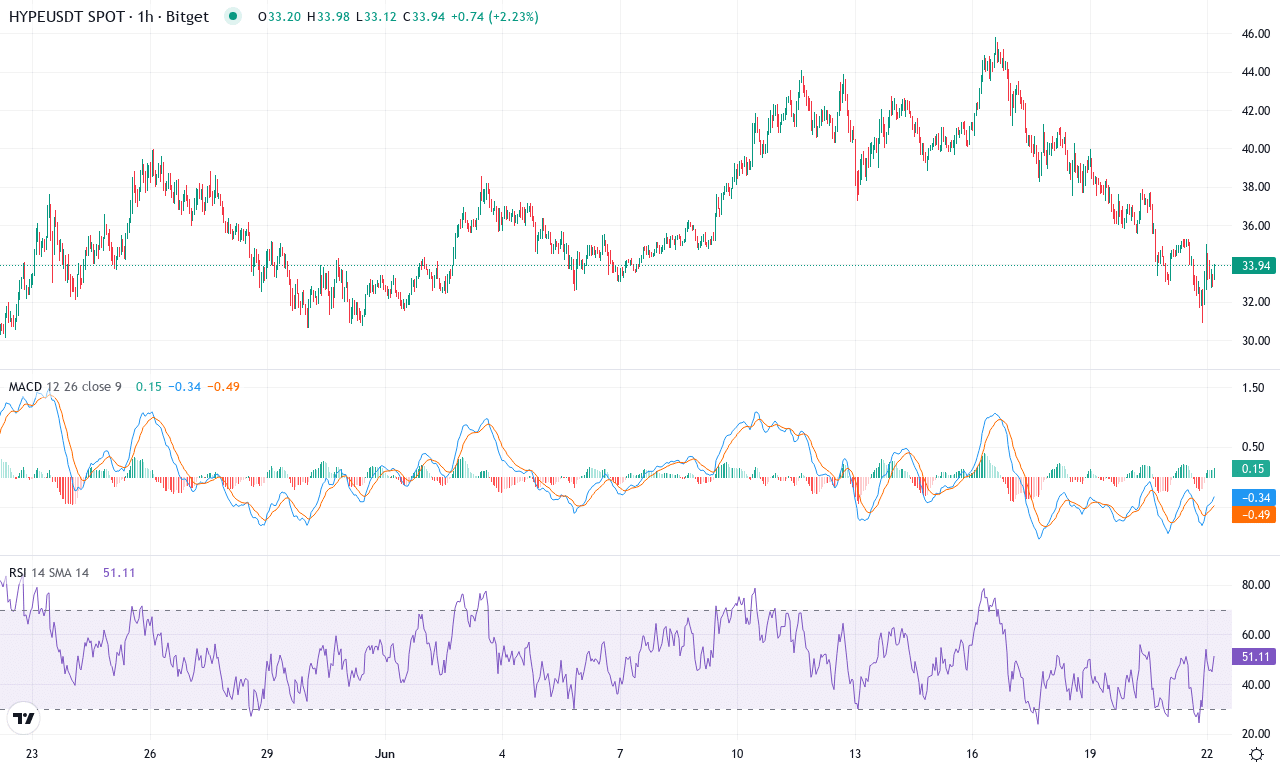
| Crypto | Close | 1W% | 1M% | RSI | ADX | MACD | CCI 20 | HYPERLIQUID(HYPE) | $33.82 | -15.58% | 1.32% | 44.7 | 31.0 | 0.94 | -95.86 |
|---|
After a spectacular run this quarter, Hyperliquid (HYPE) is cooling off following months of gravity-defying gains. Despite a mild 1.3% advance over the last month, this week saw bears step in with a sharp 15% slide—an unmistakable bout of profit-taking after a whopping 107% rally across three months and a staggering 1,250% in a year. Price now holds at $33.82, well off June’s high near $46. The dramatic pivot from momentum to hesitation reflects both the recent exhaustion of buyers and the psychological weight of lofty valuations. For traders, this is a classic regime shift: the market narrative is shifting from euphoric buying to a more cautious, range-bound story. At these levels, volatility is high—and every uptick or downtick is generating outsized emotional swings. I won’t lie, I’m a bit anxious here; when a parabolic advance starts to buckle, risks of a steeper correction increase.
The technical outlook suggests traders should brace for choppy price action. While trend indicators are still elevated—the weekly MACD shows lingering bullish momentum, and ADX hovers above 31—velocity is waning: the MACD histogram is losing steam, and oscillators like RSI and the Ultimate Oscillator are rolling over from overbought territory. The price has sliced through key moving averages but clings near the monthly pivot zone, indicating that both bulls and bears are staging a tug-of-war. Support is clustered near $30.60—if this floor gives way, a cascade toward $21 is not off the table. On the upside, former support around $38 has switched to stiff resistance, and only a decisive weekly close above this area will revive the bull case. The setup screams caution: if buyers regain their nerve and crack $38, next resistance waits at $45, but any loss of $30 could validate a bearish reversal and fuel accelerated long liquidations. Stay nimble—this is where legends are made (and broken).
Bittensor (TAO) Price Analysis
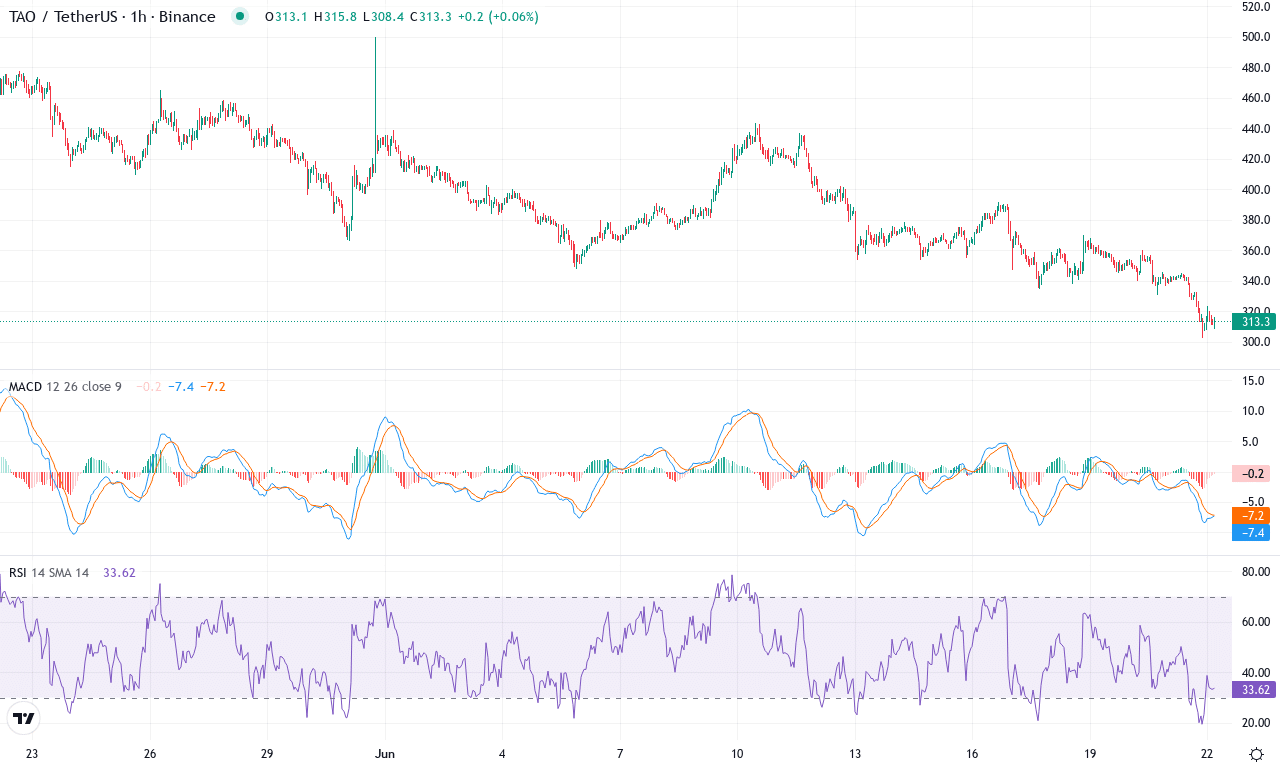
| Crypto | Close | 1W% | 1M% | RSI | ADX | MACD | CCI 20 | BITTENSOR(TAO) | $311.70 | -14.25% | -33.20% | 33.5 | 16.3 | -19.87 | -176.94 |
|---|
After a punishing month marked by a steep -33% decline, Bittensor (TAO) finds itself at a critical juncture. Price action unraveled from a lofty $500 high down to a $302 low, erasing last quarter’s gains and slamming into a wall of volatility. Momentum evaporated and buyers scattered, while even the weekly chart failed to stem the bleeding. Although long-term performance still flashes green (yearly returns are up nearly 9%), the short-term mood is undeniably tense—this isn’t the place to get complacent. As a trader, watching TAO coil at these battered levels, I’m keenly aware that another breakdown could trigger a cascade of stop orders and long liquidations. Until proven otherwise, sellers remain in control, and the next move is loaded with risk.
Diving into the technicals, trend indicators are decidedly bearish: the moving averages stack above current price, shrouding TAO in resistance all the way up toward $375–$400, and the primary trend reads as exhausted. The ADX signals elevated trend strength, but with a pronounced tilt toward sellers—negative directional momentum is outmuscling positive, and the weekly MACD continues its downward slide, deepening the bearish reversal thesis. Oscillators reinforce this grim outlook as momentum readings plunge and the RSI drops toward oversold territory, hinting that fear is overpowering hope. That said, support is clustering at $300—a round number with clear psychological gravity. If bulls fail to defend this floor, risks extend sharply toward $262 or even $200 should panic take hold. Conversely, any decisive bounce reclaiming the $350 pivot would catch shorts off guard and force rapid unwinding, with $400 then acting as the next upside magnet. For now, it’s a knife-edge—TAO’s fate hangs on whether sellers press for domination or exhausted bears finally let bulls breathe.
OKB (OKB) Price Analysis
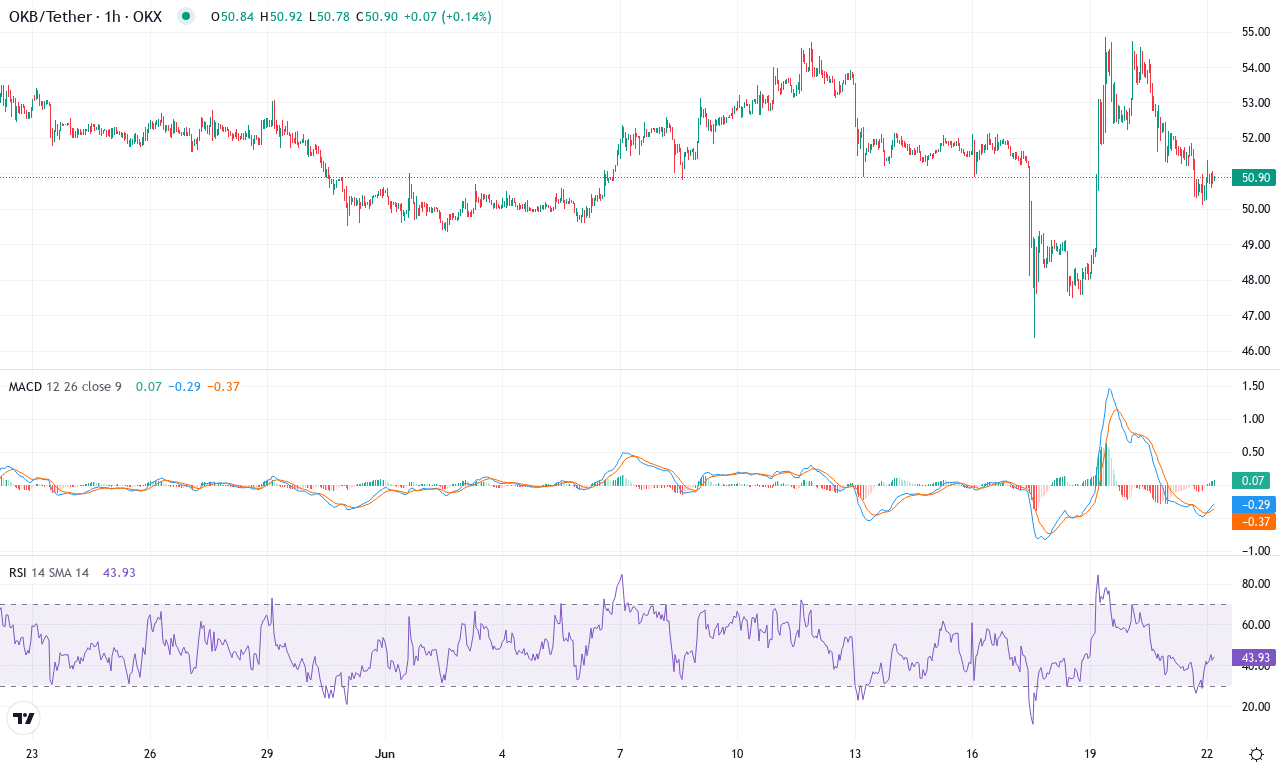
| Crypto | Close | 1W% | 1M% | RSI | ADX | MACD | CCI 20 | OKB(OKB) | $50.84 | -1.22% | -3.71% | 47.3 | 14.0 | -0.31 | -30.26 |
|---|
After a period of relative resiliency, OKB appears to be losing its bullish momentum as the token retreats from its monthly high of $54.85, slipping 3.7% over the past month. The price action remains compressed near the $50.84 mark, with a lackluster weekly performance and clear hesitation from both bulls and bears. Notably, OKB’s longer-term uptrend remains marginally intact—posting nearly 10% gains over six months and still up more than 22% year-over-year—yet short-term signals suggest waning demand. If you’ve been riding this move higher, it’s time to pay attention: we’re on the cusp of a technical inflection point, and complacency could be costly.
Digging deeper, trend indicators show OKB losing altitude. The Average Directional Index signals a gentle but persistent decline in trend strength, with the negative directional index overtaking the positive—never a sign you want to see if you’re long. The MACD is crossing below its signal line on the weekly chart, hinting that bearish reversal risks are gathering steam. Momentum oscillators echo this caution: RSI is hovering in middling territory, failing to recover meaningfully from oversold levels, while both the Commodity Channel Index and Williams %R point toward persistent weakness. Price has slipped below the 10-day EMA and is testing the 20- and 30-day averages, putting the spotlight on support around $50; if sellers seize control here, a fall to the monthly low of $46.34 is on deck. However, if bulls manage to defend $50 and push back toward resistance near $54, we could see renewed upward momentum—but for now, the technical outlook suggests risks of an extended fall outweigh the chances of a breakout. This is one of those moments where I’m holding my breath—after all, you’re not actually in the red until you sell.
Bracing for the Next Move
HYPE nears a key support level that may test bullish resolve, while TAO searches for a base after a steep decline. OKB holds above crucial support, setting the stage for potential rebound or further retreat. Each of these coins teeter on pivotal junctions, making the next trading sessions critical for confirming sentiment shifts or strengthening downward trends.