Hyperliquid Extends Parabolic Run as TRUMP Wobbles Eyes Reversal—Is a Major Rotation Brewing
After a blistering surge that sent Hyperliquid soaring by over 69%, the token now hovers at a consolidation phase above $35, teasing bullish resilience in the face of a fickle market. Meanwhile, OFFICIAL TRUMP experiences a stark pullback after its eye-popping 160% rally, with recent volatility suggesting a critical decision point for traders. As these dynamics unfold, are we on the cusp of a major rotation or merely caught in transient tides? Let’s take a closer look at the signals behind these market moves.
Hyperliquid (HYPE)
| Crypto | Close | 1W% | 1M% | RSI | ADX | MACD | CCI 20 |
|---|---|---|---|---|---|---|---|
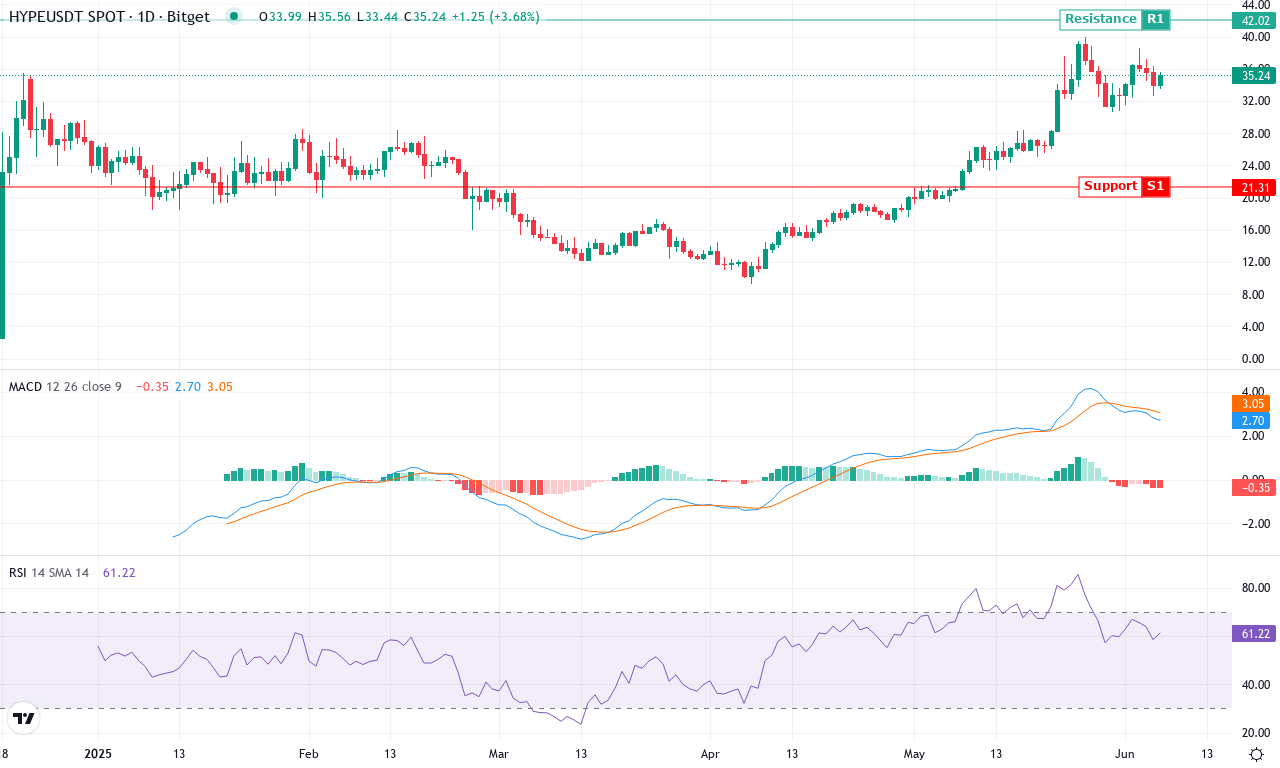
| HYPERLIQUID (HYPE) | $35.32 | 12.59% | 68.43% | 61.4 | 44.6 | 2.71 | 39.85 |
After an explosive month-long rally that saw Hyperliquid climb more than 69%, momentum refuses to cool down. The token set a fresh monthly high near $40, pulled back only modestly, and is now consolidating above $35—a level that’s acting as a springboard for bulls. Monthly returns topping 130% underscore a feverish run far outpacing most of the broader crypto market. With price blasting through long-term exponential moving averages and well above its six-month trend, the technical outlook suggests bullish momentum remains firmly in command. The drama here is real—Hyperliquid’s parabolic surge reminds me of early bull markets, when caution and FOMO clash at every tick.
Digging into the technicals, oscillators are painting a picture of raw strength. The trend indicator still prints a strong value, and the positive directional index remains firmly over the negative, confirming broad buyer control. The MACD line shows continued upside acceleration, while the Awesome Oscillator signals persistent upward momentum—hardly a whisper of bearish divergence. Relative Strength Index readings surge well above typical thresholds, hinting at overbought territory, but in a market this hot, overbought can persist far longer than logic suggests. Support has firmed up around $31, just under the ten-day EMA, with $40 standing out as the major resistance gate; a surge through here could propel HYPE towards uncharted territory. However, if sellers wrestle back control and drive price under $31, risks of a sharp correction grow. Personally, I’m electrified by the velocity here—but discipline is key; don’t chase blindly when volatility is this unforgiving.
OFFICIAL TRUMP (TRUMP)
| Crypto | Close | 1W% | 1M% | RSI | ADX | MACD | CCI 20 |
|---|---|---|---|---|---|---|---|
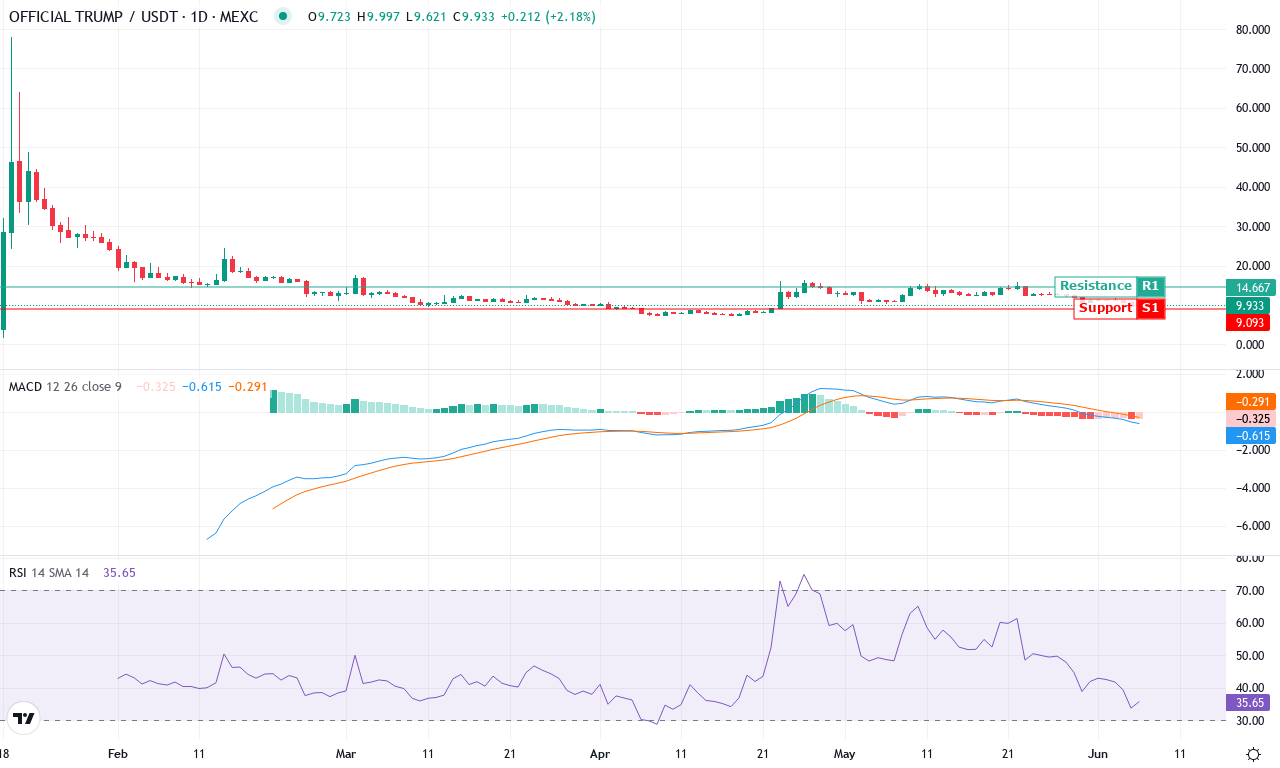
| OFFICIAL TRUMP (TRUMP) | $9.95 | -16.70% | -10.05% | 35.8 | 18.1 | -0.61 | -142.12 |
After an explosive rally earlier this year, OFFICIAL TRUMP (TRUMP) has endured a sharp pullback, dropping more than 16% over the last week and extending losses to 10% for the month. This correction stands in stark contrast to its massive 160% surge over the past six months, a run that put the coin on every momentum trader’s radar. Now, TRUMP is trading near $9.90, closer to the monthly lows than its prior high near $16, as volatility surges and traders weigh profit-taking against the lingering undercurrents of institutional interest. From a macro standpoint, the technical outlook suggests the uptrend is pausing, not reversing—but the coming days will be decisive. If you’ve been riding this trend, this is that classic gut-check moment where conviction is tested against fast-changing price action.
Digging into the technicals, a cluster of signals hint at weakening bullish momentum and potential for further downside before stabilization. Trend indicators, including the average directional index, remain elevated—a sign trend strength is still present—but the increasing negative directional line and cooling oscillators point to sellers regaining control. The MACD has crossed below its signal line and is moving deeper into negative territory, reinforcing the shift. Momentum oscillators remain under pressure, and while RSI has slipped from overheated territory, it’s not deeply oversold yet—there’s still room for bears to push lower. TRUMP is also hovering below its 10- and 20-day moving averages, underscoring the downside pressure and rendering the $12.50–$13.50 band a critical resistance zone. On the flip side, psychological support sits around $9.00—if that fails, risks of a steep correction toward $7 intensify. Conversely, a bounce above $12.50 would likely squeeze late shorts, potentially reigniting the bullish narrative. Personally, I’m watching the $9 area like a hawk; lose it, and long liquidations could snowball. As always, discipline and readiness for volatility are absolutely essential in this climate.
Is a Major Rotation Imminent?
Hyperliquid continues to hold above $35, poised for potential gains in a stabilizing trajectory. While OFFICIAL TRUMP’s retreat hints at vulnerability, its next moves will depend on trader sentiment. Traders should stay alert: these shifts may signal an evolving market rotation, or simply the prelude to further upheaval.